
A SaaS engineering org starts measuring developer experience, builds a dashboard of DORA metrics per team, and puts it on a screen in the office. Within two quarters deployment frequency is up across every team and nothing feels better.
Teams learned to split changes into more, smaller deploys, which is not inherently bad, and the metric moved without the underlying experience changing at all. Meanwhile the thing actually driving people to leave, a twenty-minute local build and a flaky test suite nobody owns, appears on no dashboard because it is not a delivery metric.
The measurement worked exactly as designed. It measured the wrong thing and then created pressure to game it.
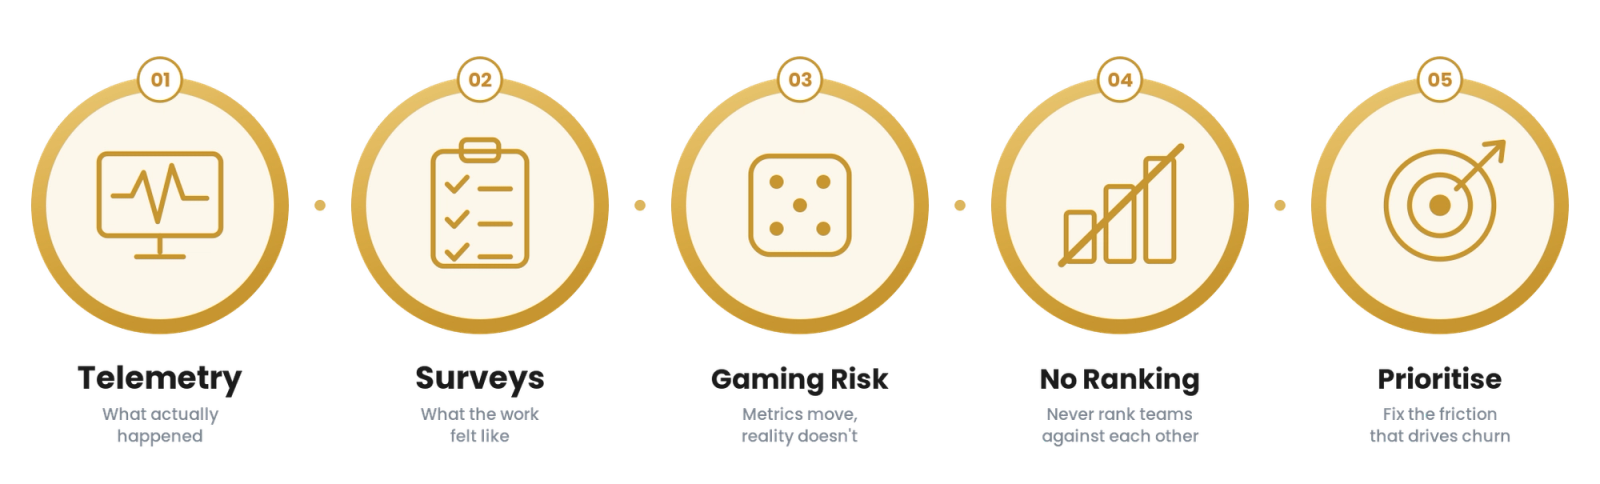
Telemetry tells you what happened. Surveys tell you what it felt like. You need both, and you must never rank teams with either.
Developer experience metrics for SaaS means combining system telemetry with periodic self-reported data to understand where friction actually sits across many teams, used to prioritise platform work rather than to compare or rank teams against each other.
However, most orgs adopt delivery metrics per team, publish a leaderboard, and produce gaming and resentment instead of insight.
If you are a VP of Platform Engineering or Head of Developer Experience at a SaaS company, the intent of this article is:
- Define what telemetry and surveys each measure and where each fails
- Show why per-team ranking destroys the data you were collecting
- Lay out which friction signals actually predict retention
To do that, let's start with the basics.
The Three Dimensions of Developer Experience That Actually Pay Off
Improve developer experience by optimizing feedback loops, cognitive load, and flow.
What Are Developer Experience Metrics for SaaS? The Basic Definition
At a high level, developer experience metrics in a SaaS org combine two kinds of data. Telemetry is what your systems record: build durations, test suite runtimes, deployment frequency, lead time, change failure rate, time waiting for environments, and how often people are interrupted by production issues.
Surveys are what developers report: whether they can find documentation, whether they trust the test suite, how long it takes to get an answer, how much of their week goes to work they consider pointless.
Telemetry is precise about what happened and silent about why. Surveys are noisy but explain causes. Used together across thirty teams, they show where friction concentrates. Used to rank teams, they show you what people are willing to report.
To compare:
Telemetry is a fitness tracker. It knows your heart rate and step count and has no idea you have been miserable all week. A survey is asking how you feel, which is subjective and occasionally the only way to learn that your knee hurts.
A doctor uses both. A doctor who published patient step counts on a leaderboard and tied them to appraisal would get step counts that no longer mean anything. That is precisely what happens when developer experience metrics are used to compare teams.
Why Are Developer Experience Metrics Necessary for SaaS?
Issues that it addresses or resolves:
- Platform work prioritised by opinion rather than by measured friction
- Friction concentrated in places nobody has instrumented
- Delivery metrics gamed because they became performance measures
Resolved Issues by Measuring Well
- Friction located precisely across many teams
- Platform roadmap driven by evidence rather than anecdote
- Honest self-reported data because nobody is being ranked
Core Components of Developer Experience Metrics in SaaS
- Telemetry covering the full path from local build to production
- Periodic surveys with consistent questions over time
- Aggregation at org and capability level, never per-team ranking
- Friction signals that correlate with attrition
- A feedback loop from measurement to platform work
Modern DevEx Measurement Tooling for SaaS
- Build and test telemetry captured from CI and local environments
- Delivery metrics collected from pipelines rather than self-reported
- Survey tooling with consistent, comparable questions
- Dashboards aggregated by capability, not by team leaderboard
- Analysis linking friction signals to retention data
These tools make measurement useful. The technical part is straightforward; the discipline of never using the data for comparison is what keeps it honest across thirty teams.
Other Core Issues They Will Solve
- Platform teams know which friction to remove first
- Improvements are provable rather than asserted
- Developers see their feedback change something
In Summary: Developer experience metrics for SaaS combine telemetry and surveys to locate friction across many teams, used to prioritise platform work rather than to compare teams, because comparison destroys the data.
Importance of DevEx Measurement for SaaS in 2026
Platform investment is being scrutinised, and the case has to be made with evidence. Four reasons explain why measuring well matters now.
1. Platform budgets need proof.
Asserting that developer experience improved is not persuasive. Showing that median environment wait fell from four hours to nine minutes is.
2. Friction hides in places nobody instruments.
Local build times, test flakiness, and documentation search rarely appear on delivery dashboards and are frequently the biggest daily irritants.
3. Retention is expensive.
Replacing a senior engineer costs far more than fixing the test suite that helped push them out.
4. Ranking teams destroys the signal.
Once metrics affect appraisal, they measure reporting behavior rather than reality, and you cannot get the honesty back easily.
Traditional vs. Modern SaaS Developer Measurement
- Delivery metrics alone vs. telemetry plus self-reported experience
- Per-team leaderboards vs. aggregation by capability and org
- Metrics as performance measures vs. metrics as product signals
- Annual engagement survey vs. consistent, frequent, targeted questions
In summary: A modern SaaS approach measures both what happened and how it felt, aggregates to find friction, and never uses the results to compare teams.
Details About the Core Components of DevEx Metrics in SaaS: What Are You Designing?
Let's go through each component.
1. Telemetry Layer
What systems record.
Telemetry decisions:
- The full path instrumented, from local build to production
- Waiting time captured, not just active time
- Data collected automatically rather than self-reported
2. Survey Layer
What developers report.
Survey decisions:
- Questions kept consistent so trends are readable
- Frequency high enough to be useful, low enough to answer
- Free text read, not just scored
3. Aggregation Layer
How data is presented.
Aggregation decisions:
- Reported by capability and org, never as a team ranking
- Small teams protected from identification
- Distribution shown, not just medians
4. Friction Layer
What actually hurts.
Friction decisions:
- Local build and test times tracked
- Time to get an answer measured
- Interruption load counted
5. Loop Layer
Measurement to action.
Loop decisions:
- Findings drive roadmap items
- Changes reported back to developers
- Improvement verified in the next cycle
Benefits Gained from Good DevEx Measurement in SaaS
- Platform work targeted at the friction that actually costs time
- Improvements demonstrable to leadership with evidence
- Honest feedback because reporting carries no risk
How It All Works Together
The SaaS platform team instruments the whole path a developer travels, not just the parts that produce delivery metrics. That means local build times and test suite duration alongside pipeline data, time spent waiting for an environment alongside deployment frequency, and interruption load alongside change failure rate.
Telemetry answers what happened precisely and says nothing about why, so periodic surveys fill the gap with consistent questions asked often enough to show trends, including free text that gets read rather than scored.
Everything is aggregated by capability and across the org rather than presented as a per-team comparison, because the moment a team's numbers appear next to another team's, the data starts measuring reporting behavior instead of reality.
The friction signals that correlate most strongly with people leaving, long feedback loops, tests nobody trusts, waiting on other teams, work perceived as pointless, get particular attention. Findings become roadmap items with owners, changes get reported back to the developers who reported the problem, and the next measurement cycle checks whether the fix worked.
That loop, measurement to action to visible feedback, is what makes people keep answering honestly.
Common Misconception
DORA metrics measure developer experience.
They measure delivery performance, which is related and not the same, and treating them as a proxy is how orgs end up with better numbers and unchanged misery. Deployment frequency, lead time, change failure rate, and time to restore describe how software reaches production.
None of them capture a twenty-minute local build, a test suite that fails randomly, documentation that is wrong, or the three days spent waiting for another team to answer a question. Those are the things developers describe when asked what makes their week bad, and they are largely invisible in delivery metrics.
Worse, when DORA metrics become per-team targets they are trivially gamed: split changes smaller and frequency rises without anything improving. Use them, but use them as one input among several and never as a scoreboard.
Key Takeaway: DORA measures delivery, not experience. The friction that drives people out is usually upstream of anything a pipeline records.
Real-World DevEx Measurement for SaaS in Action
Let's take a look at how it operates with a real-world example.
We worked with a SaaS org whose per-team DORA dashboard produced gaming and no improvement, with these constraints:
- Measure the whole developer path, not just the pipeline
- Combine telemetry with consistent self-reported data
- Never present metrics as a team-versus-team comparison
Step 1: Instrument the Whole Path
Including local.
- Local build and test times captured
- Waiting time measured, not just active time
- Data collected automatically
Step 2: Ask Consistently
Surveys that trend.
- Questions kept stable over time
- Frequency balanced against fatigue
- Free text read and coded
Step 3: Aggregate, Never Rank
Protect the signal.
- Reported by capability and org
- Small teams protected from identification
- Distributions shown, not just medians
Step 4: Target the Friction
What actually hurts.
- Long feedback loops prioritised
- Flaky tests given an owner
- Interruption load reduced
Step 5: Close the Loop
Report back.
- Findings become roadmap items
- Changes communicated to developers
- Improvement verified next cycle
Where It Works Well
- Orgs willing to keep metrics out of performance management
- Platform teams using data to prioritise their own roadmap
- Cultures where free text feedback is read and acted on
Where It Does Not Work Well
- Any org that publishes per-team leaderboards
- Metrics tied to appraisal or headcount decisions
- Surveys run without any visible follow-up action
Key Takeaway: Measure both telemetry and sentiment, aggregate rather than rank, and act visibly, or you will get numbers that describe reporting behavior instead of reality.
Common Pitfalls
i) Ranking teams
The moment metrics compare teams, they stop measuring reality. People optimise the number, stop reporting problems honestly, and the dataset becomes worse than nothing because it looks authoritative.
- Delivery metrics get gamed within a quarter
- Survey honesty collapses
- Recovering trust takes far longer than losing it
ii) Measuring only the pipeline
Delivery telemetry misses local builds, flaky tests, documentation quality, and waiting on other teams, which is where most daily friction lives. Instrument the whole path.
iii) Surveying without acting
Asking developers how things are and then changing nothing teaches them not to answer. Every cycle should produce visible roadmap items traceable to feedback.
iv) Changing the questions
Rewriting survey questions each cycle destroys comparability. Keep them stable long enough to see trends, and add new ones rather than replacing old ones.
Takeaway from these lessons: The technical measurement is easy. The discipline of aggregating rather than ranking and acting rather than collecting is what makes it work.
DevEx Measurement Best Practices for SaaS: What High-Performing Teams Do Differently
1. Combine telemetry and surveys
Use system data for precision and self-reported data for causes, because neither alone tells you where to spend platform effort.
2. Never rank teams
Aggregate by capability and org, protect small teams from identification, and keep the data out of performance management entirely.
3. Instrument local development
Track build and test times on developer machines, since that is where a large share of daily friction sits and where dashboards rarely look.
4. Watch the retention-linked signals
Long feedback loops, untrusted tests, waiting on other teams, and work perceived as pointless are the friction that shows up in exit conversations.
5. Close the loop visibly
Turn findings into roadmap items, tell developers what changed because of their feedback, and verify improvement in the next cycle.
Logiciel's value add is helping SaaS engineering orgs build developer experience measurement that combines telemetry and sentiment, locates real friction across many teams, and stays out of performance management so the data stays honest.
Takeaway for High-Performing Teams: Measure what happened and how it felt, aggregate rather than compare, prioritise the friction that predicts attrition, and act where developers can see it.
Signals You Are Doing DevEx Measurement Well in SaaS
How do you know it is working? Not by how many metrics you collect, but by whether the data changes what you build. These are the signals that separate insight from a dashboard.
Both kinds of data exist. Telemetry and self-reported experience are collected and read together.
Nobody is ranked. Metrics never appear as team comparisons or in appraisals.
Local friction is visible. Build and test times on developer machines are tracked.
Feedback changes things. Developers can point to something fixed because they reported it.
Response rates hold. People still answer the survey after four cycles.
Adjacent Capabilities and Connected Work
This work does not exist in isolation. DevEx measurement depends on, and feeds into, the surrounding platform. Ignoring the adjacencies is the most common scoping mistake.
Your platform roadmap is what the measurement should drive. Golden paths are what the data tells you to improve. Self-service infrastructure removes the waiting time telemetry keeps surfacing. Team topologies explain why some friction is structural rather than technical.
Naming these adjacencies upfront keeps the work scoped and helps leadership see measurement as a prioritisation tool rather than a reporting exercise.
The common mistake is treating each adjacency as someone else's problem. The instrumentation is your problem. The aggregation discipline is your problem. The feedback loop is your problem. Pretend otherwise and you build a dashboard nobody trusts and nobody uses.
Own the adjacencies you depend on, partner with the teams that hold them, and share the findings.
Conclusion
Developer experience measurement works when it combines telemetry and sentiment, covers the whole path including local development, aggregates rather than ranks, and produces visible action. Delivery metrics are a useful input and a terrible scoreboard, because they measure how software reaches production rather than what a bad week feels like.
The friction that pushes engineers out, long feedback loops, tests nobody trusts, waiting on other teams, work that feels pointless, mostly sits upstream of anything your pipeline records. Instrument it, ask about it consistently, act on it visibly, and never put it next to a team's name on a leaderboard.
See What Elite-Tier SaaS Engineering Teams Actually Look Like in 2026
See what elite SaaS engineering performance looks like across key metrics.
Key Takeaways:
- Telemetry says what happened; surveys say why, and you need both
- Ranking teams converts measurement into reporting behavior within a quarter
- The friction that predicts attrition is usually invisible in delivery metrics
Measuring developer experience well requires discipline. When done correctly, it produces:
- Platform work targeted at friction that actually costs time
- Improvements you can demonstrate with evidence
- Honest feedback because reporting carries no risk
- A roadmap developers recognise as responding to them
What Logiciel Does Here
If your DORA dashboard improved while nothing felt better, we help you build measurement that combines telemetry and sentiment, finds the real friction, and drives your platform roadmap.
Learn More Here:
- Platform Engineering Metrics for Technology & SaaS
- Developer Cognitive Load for Technology & SaaS
- Golden Paths for Technology & SaaS
At Logiciel Solutions, we work with SaaS engineering leaders on developer experience measurement. Our reference patterns come from programmes running across many product teams.
Book a technical deep-dive on measuring developer experience without breaking it.