Checklists and scoring frameworks from real engagements, not from a content brief. Each one fits on a single screen and survives being pasted into Slack.
 Infographic
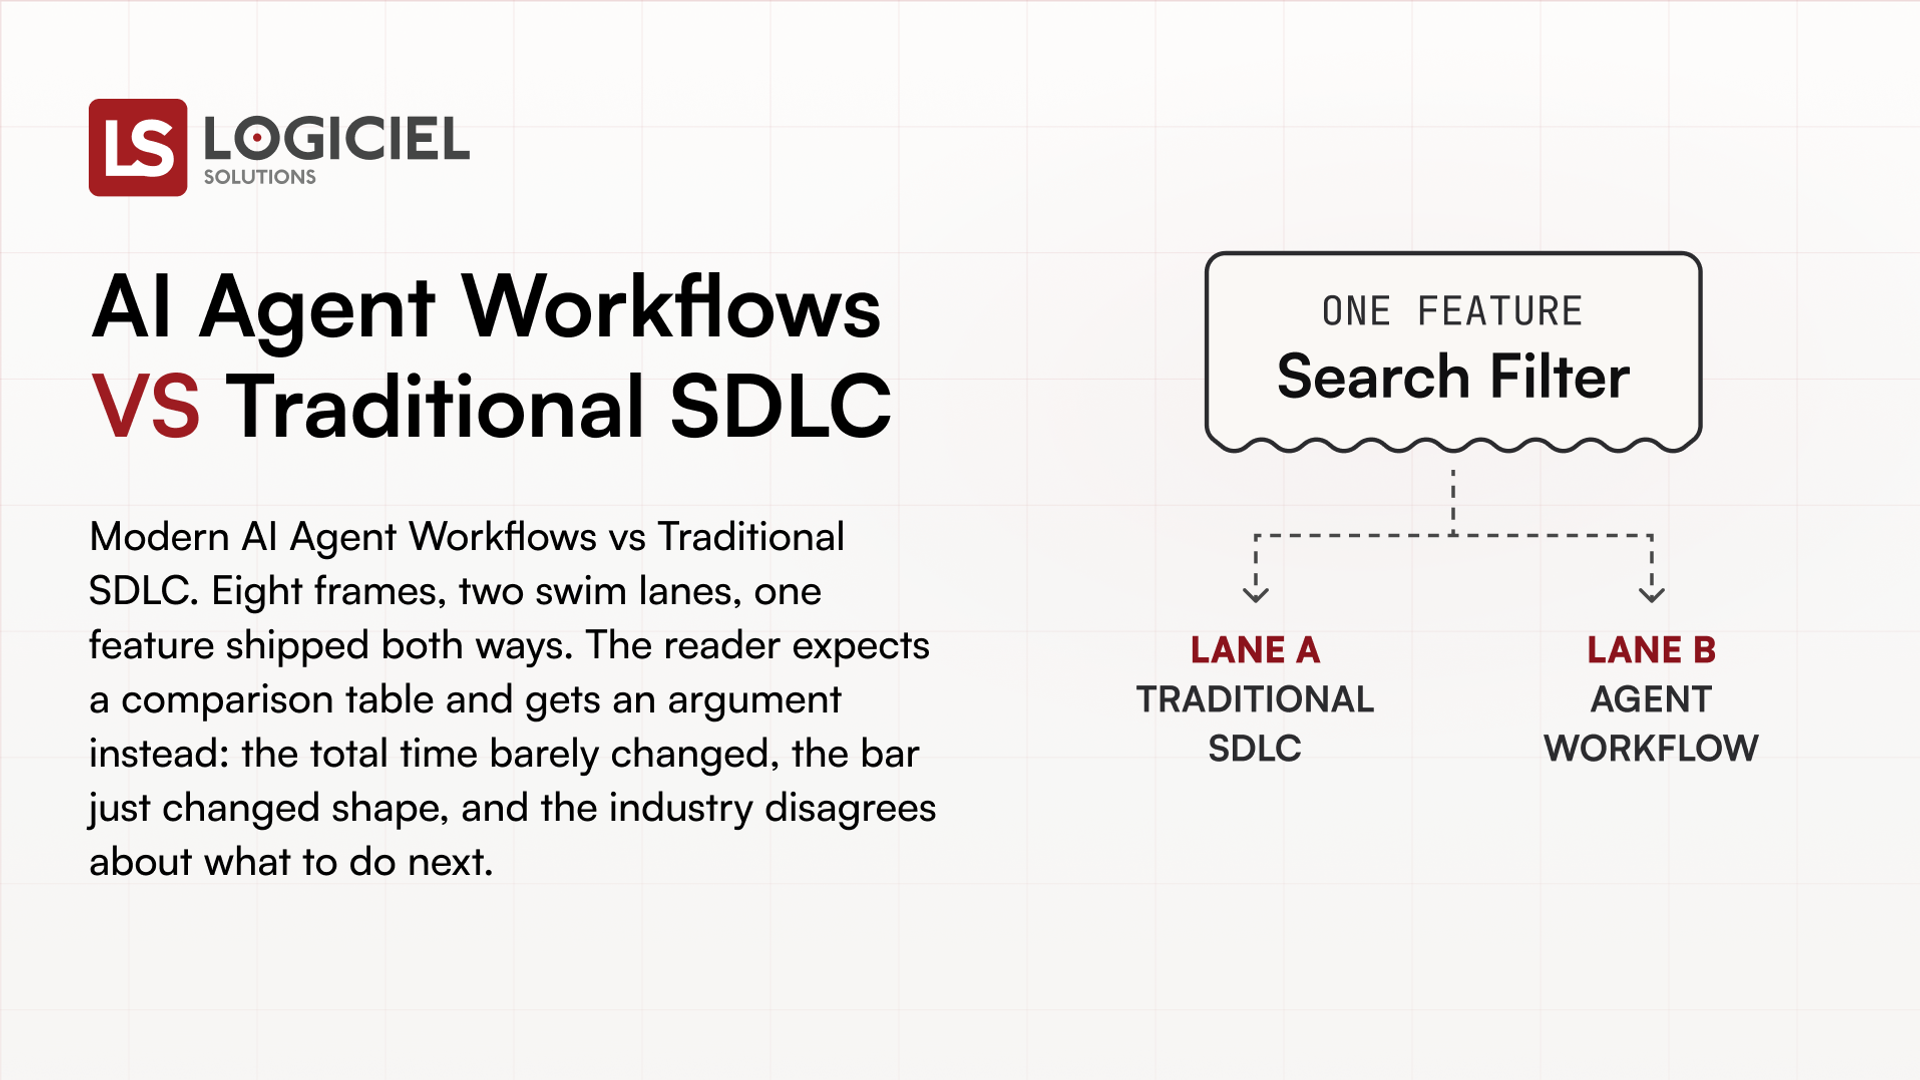
The agent writes the feature in 40 minutes and it ships 3 days earlier. Where the rest of the time went, and why the industry disagrees about the fix.
 Infographic
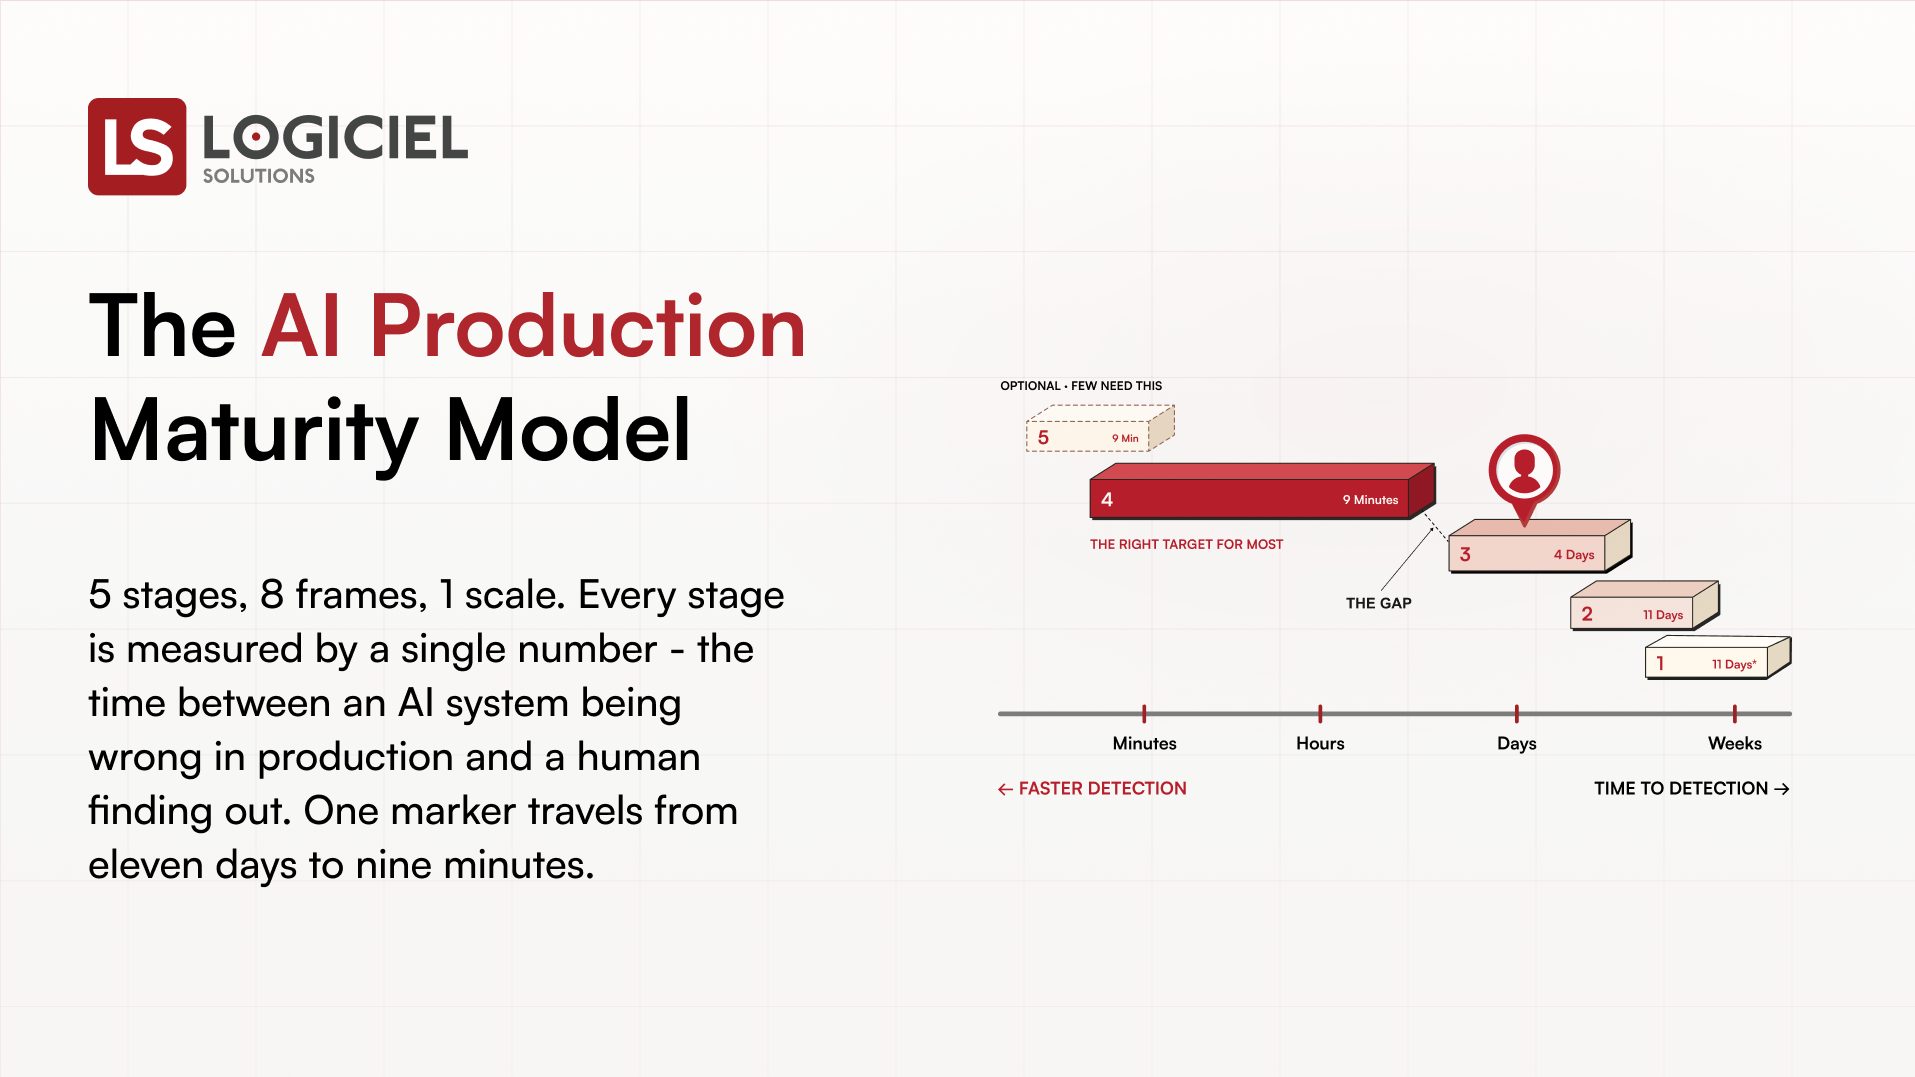
Five stages, eight frames, one scale: the time between an AI system being wrong in production and a human finding out. One marker travels from eleven days to nine minutes.
 Infographic
A working AI agent is a go-kart: great on the track, not allowed on the road. Seven stops, twelve parts, and the safety kit most teams skip.
 Infographic
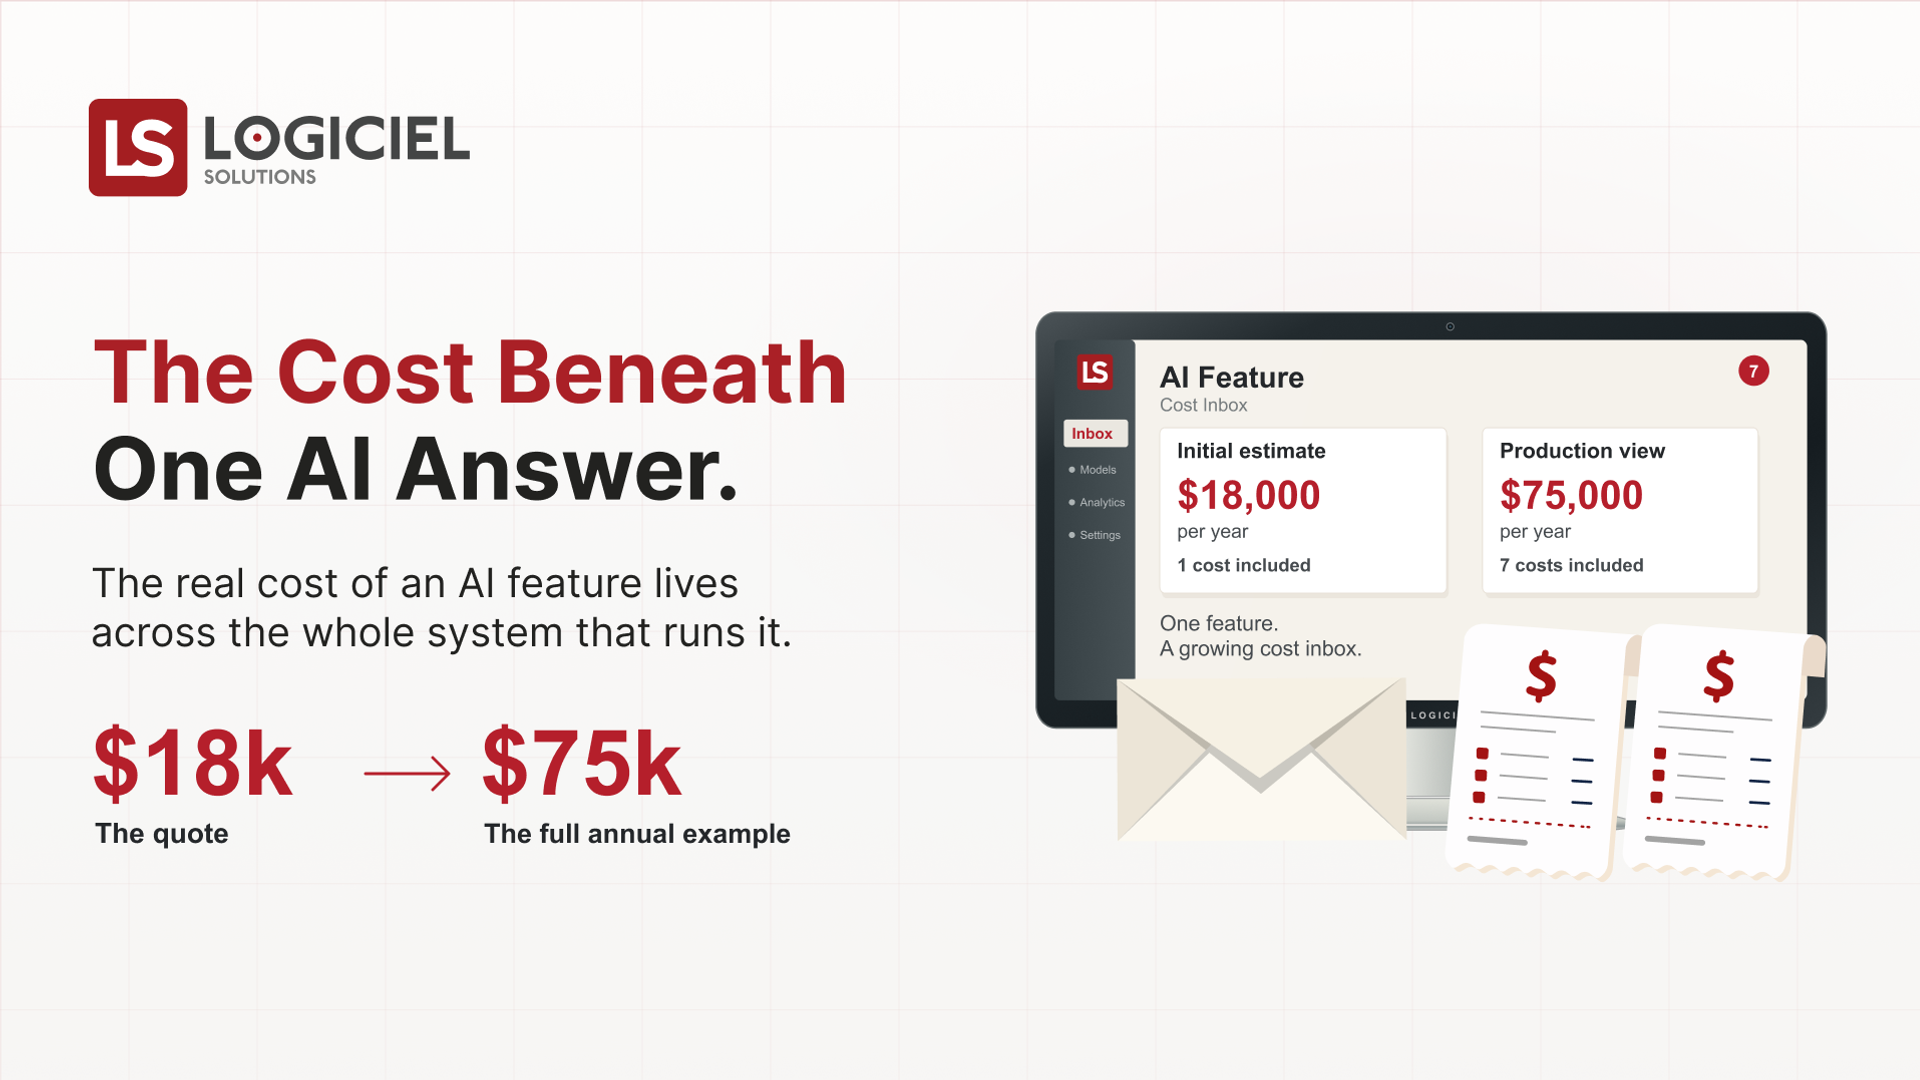
Inference is 24% of what an AI feature costs to run. Seven line items in a real annual bill, month by month, and the two that usually dominate.
 Infographic
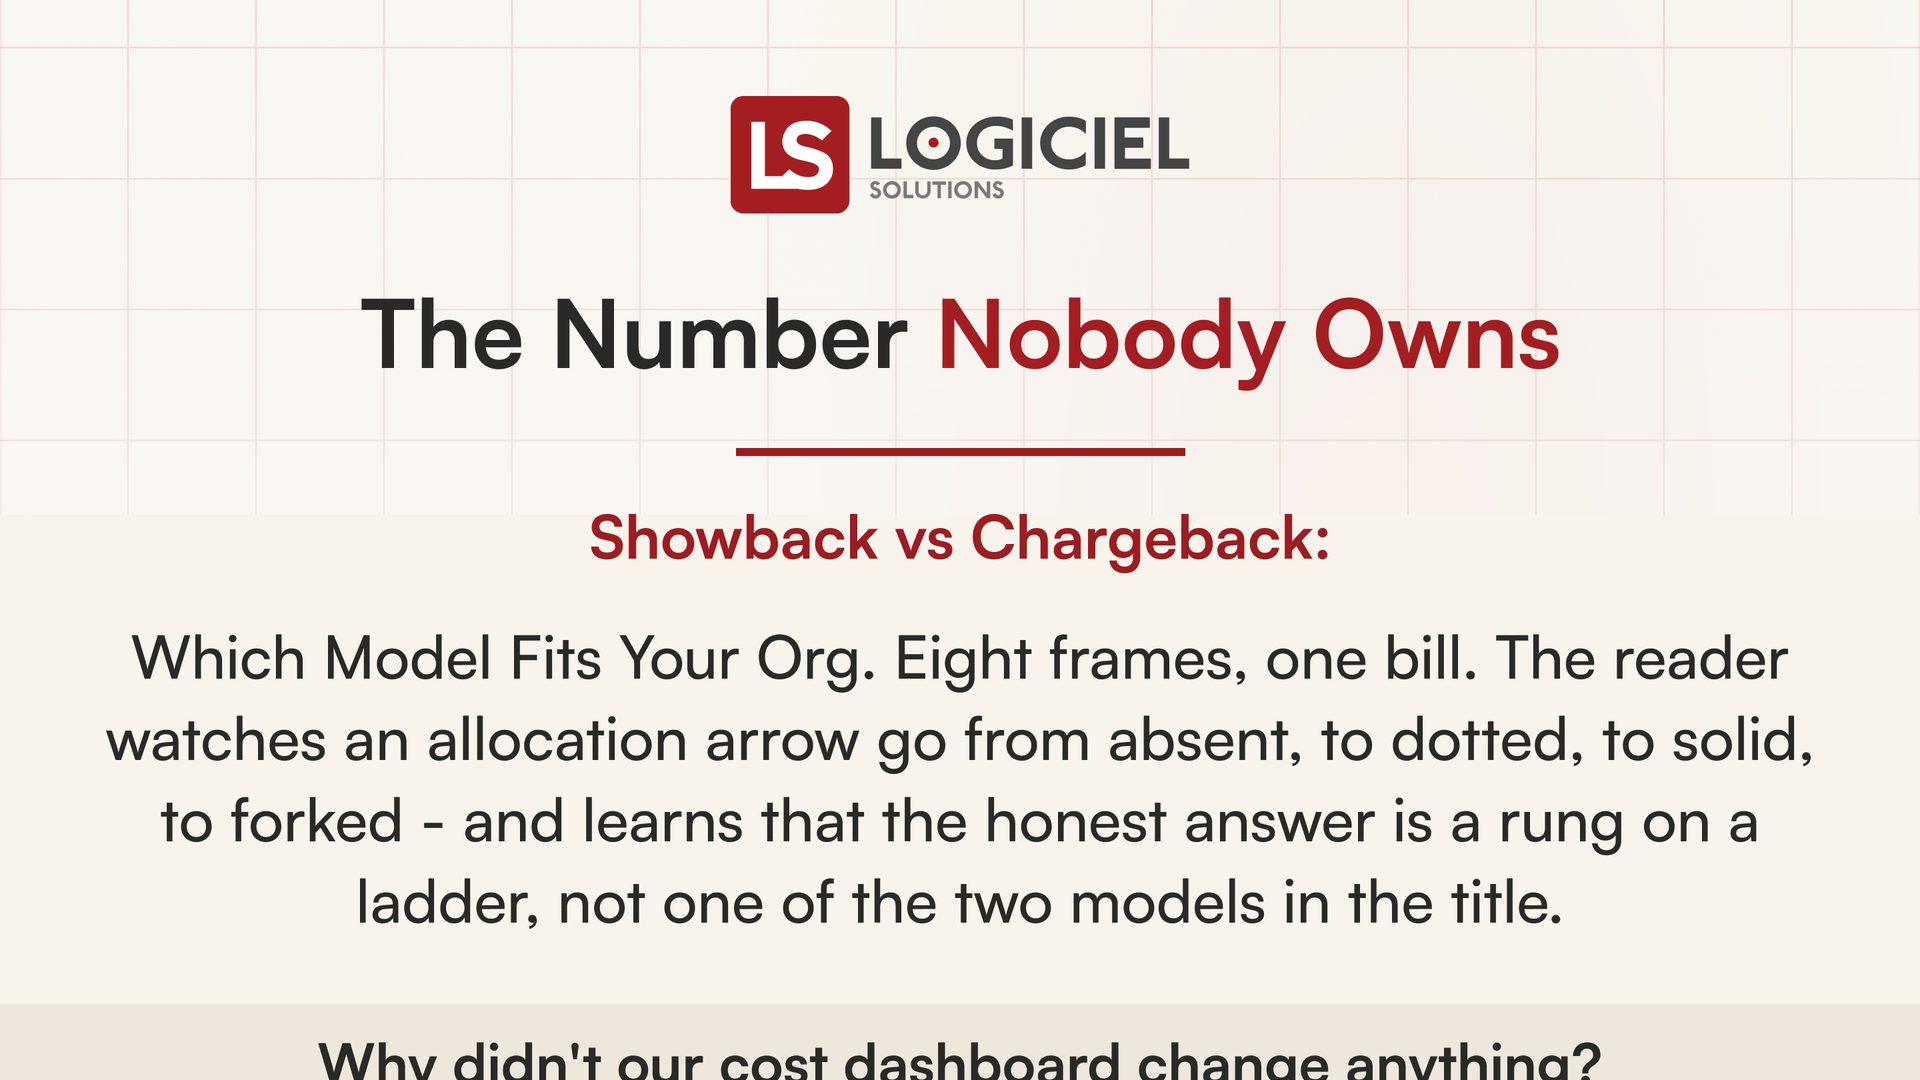
Eight frames, one cloud bill. Showback, chargeback and the five-rung allocation ladder - and which rung your org should stand on.
 Infographic
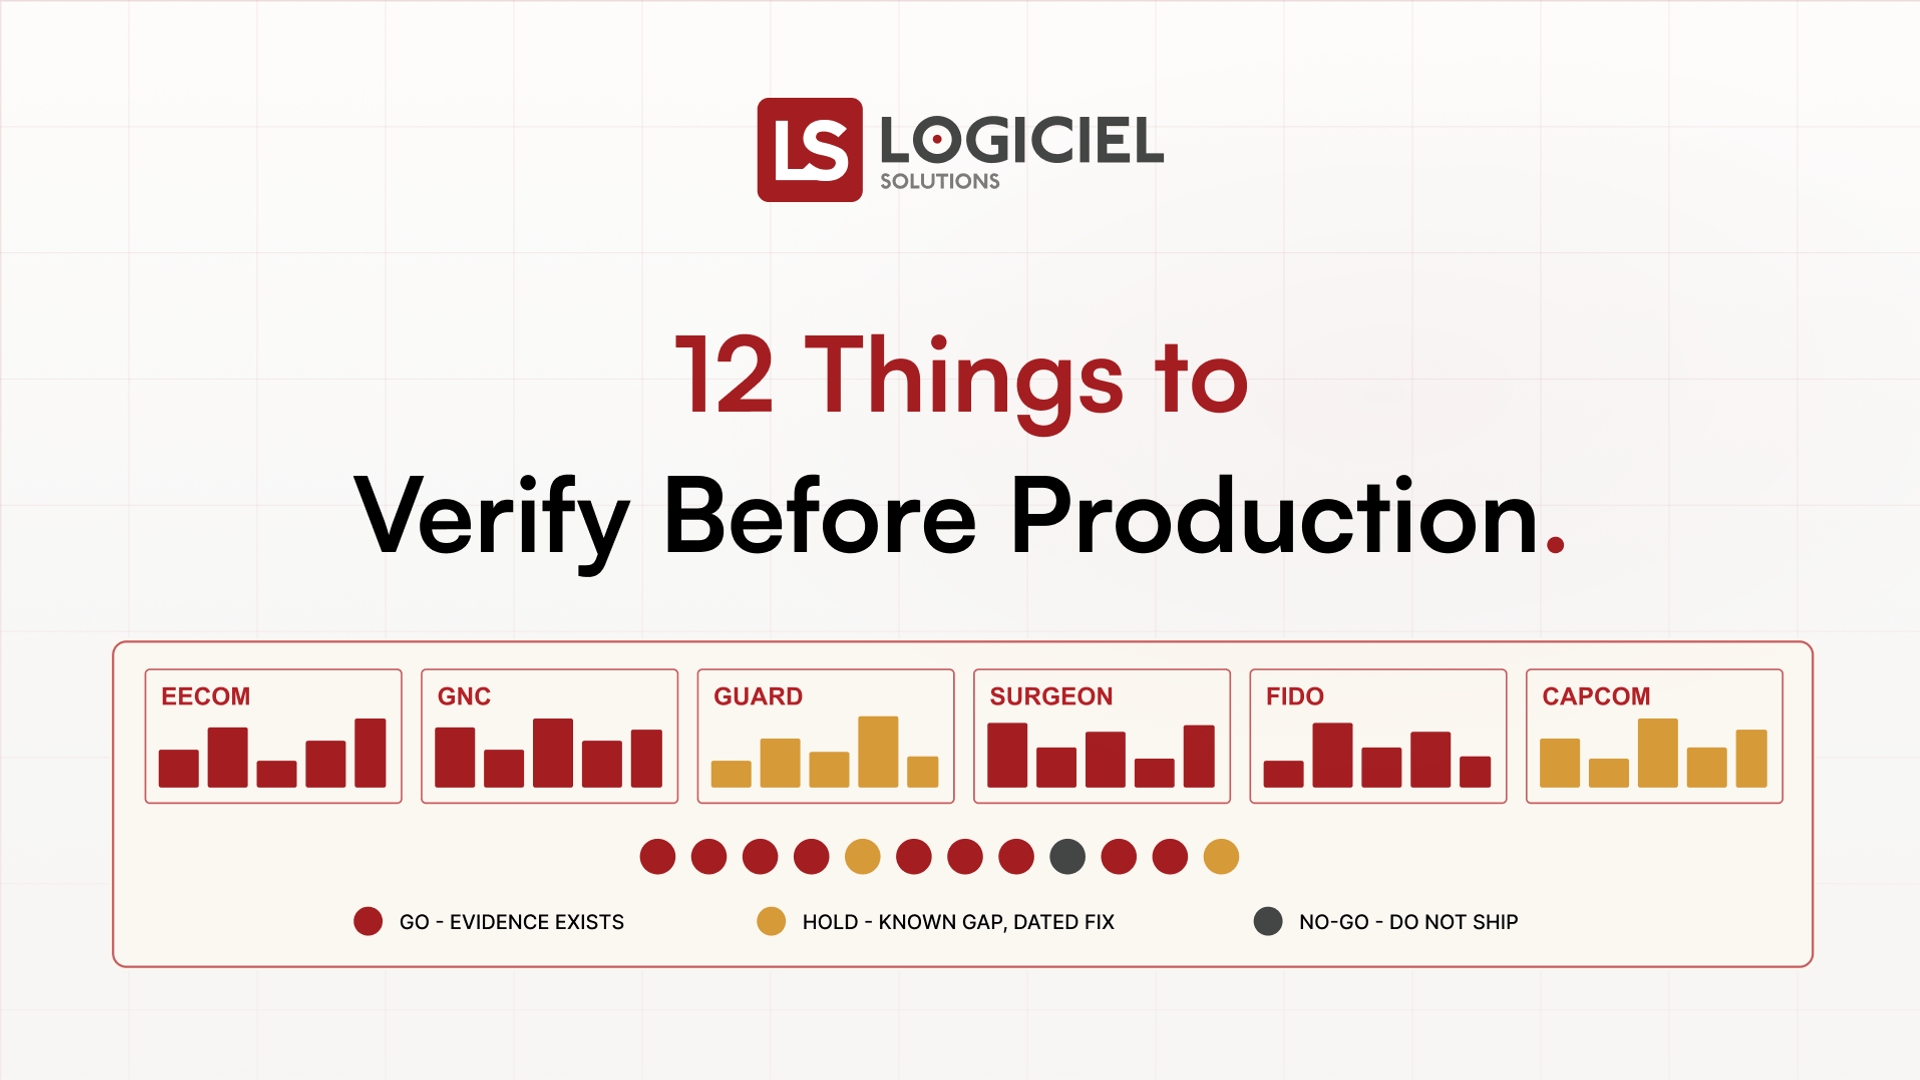
Twelve go/hold/no-go checks across data, evaluation, guardrails, observability, cost and ownership - what Mission Control asks before an AI system carries real traffic.
 Infographic
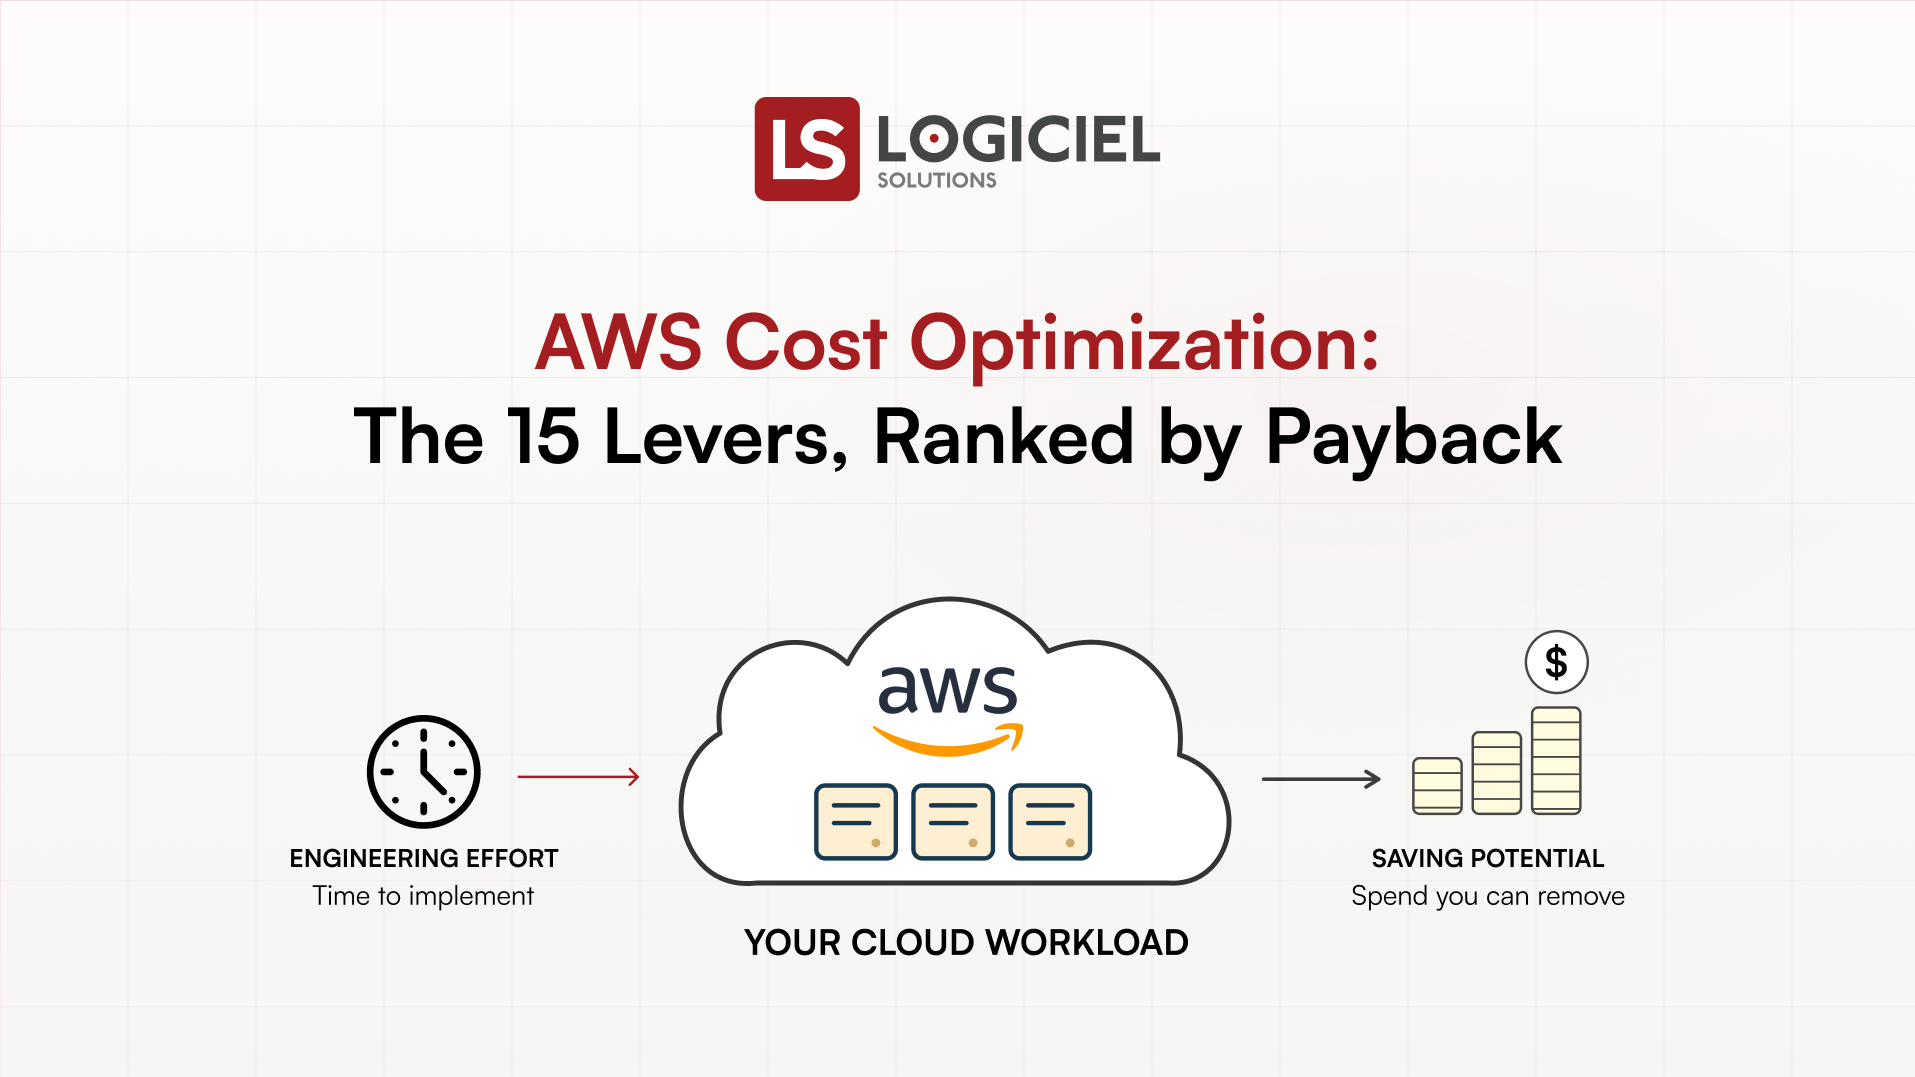
Ten AWS cost levers ranked by payback - so the next move is the highest-leverage one, not the loudest one.
