When the Total Bill Hides the Real Question
A CFO opens the AI cloud bill: $340K for the month. The number provokes the same response as a 22 percent telecom invoice. Is it appropriate? Compared to what? The total tells the CFO nothing about whether the feature unit economics work or whether the next feature should be launched at all.
The number that matters is cost per request, often expressed as cost per feature use, cost per active user, or cost per workflow execution depending on the product context. Without this number, AI investment decisions are made on aggregate trends rather than on unit economics, and trends can be misleading at the unit level.
A16Z's enterprise AI economics research consistently emphasizes the unit-economics framing as the differentiator between AI investments that scale and AI investments that buckle (A16Z, "The State of AI Infrastructure 2024"). The framing is not abstract; it has a specific calculation.
The Five Inputs to the Calculation
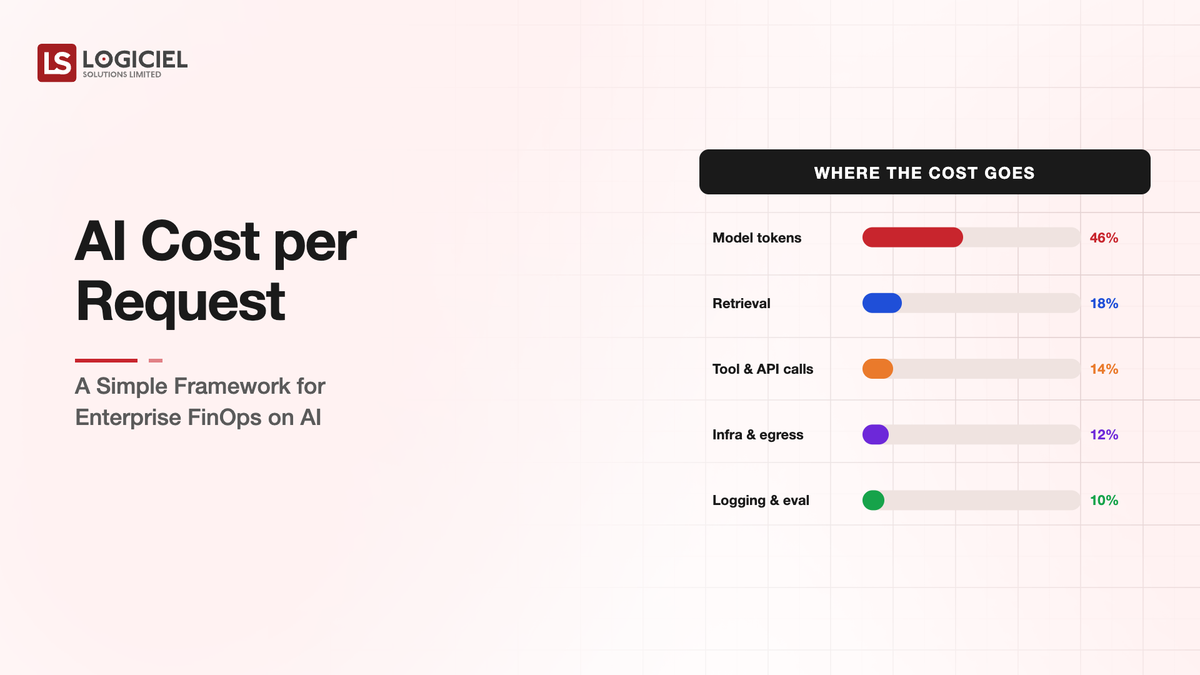
Cost per request is determined by five inputs. Each one is measurable. Their product is the cost per request number that product, finance, and engineering can share as a common language.
Input one is input tokens per request. Average length of system prompt, user input, retrieved context, few-shot examples, structured output schema directives, all the tokens that enter the model. Measured per request, averaged across the workload.
Input two is output tokens per request. Average length of the model's response. Often longer than teams expect because verbose responses cost real money. The output token rate also affects latency, which is its own consideration.
Input three is model selection. The price per million input and output tokens for the specific model being used. Frontier models are 10-50x more expensive than small models. The model selection alone is the largest single lever on cost per request.
Input four is request multiplication. The number of model calls per request. Tool-using agents make multiple calls per request. Retrieval-augmented systems make embedding calls and generation calls. The total cost is the sum across all calls. Many product features look cheap per-call and expensive per-request when call counts are accounted for.
Input five is supporting infrastructure cost per request. Vector database queries, evaluation runs, observability traces, retrieval embedding generation. These do not appear on the model provider's bill but consume cloud spend that should be attributed to the request.
Multiplying these five inputs produces the cost per request number that drives intelligent decisions. Individual inputs change as the system evolves. Knowing which input is dominant tells the team where optimization will pay back.
What the Calculation Reveals
Running the calculation on a real product feature usually surprises everyone involved.
The CFO who saw $340K aggregate often discovers the cost per request is $0.17 and the feature serves 2M requests per month. The unit economics are visible. The conversation shifts from "is the total too much" to "is $0.17 per use sustainable given the value of one use."
The product manager who specified "AI summarization for every customer interaction" often discovers the cost per interaction makes the feature unfeasible at the projected scale. The product specification gets revised based on the calculation rather than launching and hitting a cost wall.
The engineer who picked the frontier model "because it gave the best demo" often discovers a small model handles 80 percent of the workload at 10 percent of the cost. Routing logic gets added based on the calculation rather than after a budget overrun.
The shared cost per request number produces shared decisions. The aggregate number produces deferred decisions.
The Operational Discipline That Maintains It
Cost per request is not a one-time calculation. It moves as the system evolves. The discipline that maintains useful cost per request data has three components.
A cost dashboard per feature, automatically computed from production telemetry. Engineering instruments the system to track tokens, calls, and supporting infrastructure usage per request. The dashboard surfaces the cost per request along with the request volume and aggregate cost. Updated daily or hourly depending on workload.
Cost anomaly detection that flags when cost per request shifts meaningfully. A 15 percent increase in cost per request within a week is usually a signal of something changing (model update, prompt regression, retrieval expansion). The anomaly triggers investigation rather than waiting for the monthly bill to make it visible.
Cost reviews at product decision points. New features include cost per request estimates. Existing features have cost per request as part of quarterly product review. Cost is part of the product conversation rather than only the finance conversation.
These three components together produce sustained cost discipline. Without them, the calculation degrades into a one-time exercise that loses currency within a quarter.
The Cost Categories That Hide
Three cost categories commonly hide outside the calculation when teams first attempt it.
Embedding generation cost. Building and refreshing vector indexes for retrieval-augmented systems. The cost is real but often not attributed to user requests because the embedding work runs offline.
Evaluation cost. Running eval sets continuously, especially with LLM-as-judge graders that themselves consume tokens. The cost is justified by the quality maintenance benefit and should be visible in the calculation.
Failed request cost. Requests that errored, retried, or hit timeouts. Each retry consumes tokens. Each failure that did not produce user value still has cost. Some products have failed request rates high enough that the cost matters.
A complete cost per request calculation attributes these categories. An incomplete calculation makes the feature look cheaper than it actually is and produces cost surprises at scale.
What This Calculation Enables
A team with accurate cost per request data can make decisions that aggregate-only teams cannot.
Pricing decisions. The cost per request informs the unit pricing of the feature or product. Products priced without unit economics knowledge often underprice their AI costs.
Feature decisions. New AI features get evaluated against expected cost per use. Features whose cost economics do not work get redesigned or shelved before launch rather than discovered after.
Optimization prioritization. The cost per request reveals which features have the most cost headroom. Optimization investment goes where it produces the most return.
Architecture decisions. Build-versus-buy, model selection, vendor selection all become measurable decisions when their cost-per-request implications are visible.
Customer profitability analysis. For B2B products, cost per request rolls up to cost per customer, which informs pricing tier design and customer health monitoring.
The calculation is small. The decisions it enables are large.
What Logiciel Does Here
Logiciel works with engineering and finance teams instrumenting cost per request for AI features that have grown beyond ad hoc cost management. The work is typically structured around the five-input calculation followed by the operational discipline that maintains it.
The AI Cost Per Request framework covers the broader five-layer FinOps model. The AI FinOps Framework covers the cost optimization levers that cost per request data prioritizes.
A 30-minute working session is enough to assess your current cost data against the five-input framework.
Frequently Asked Questions
How do I instrument cost per request if I have not before?
Start with logging tokens per request from the model provider's API responses. Add supporting infrastructure attribution through tagging. Build a dashboard from the logs. Most cloud and AI gateway platforms now provide much of this out of the box.
What is a reasonable cost per request target?
Depends on product economics. For B2C products, cents per active user per month is typical. For B2B products, the math depends on the customer's willingness to pay. Cost per request below 5 percent of the value delivered per request is a usual baseline.
How do I handle workloads with highly variable request shapes?
Track distribution rather than just mean. P50, P95, and P99 cost per request. Highly variable workloads often have a small percentage of expensive requests that dominate aggregate cost. The distribution surfaces these.
How does cost per request interact with revenue per request?
For products with direct revenue attribution, the ratio is the unit economic margin. For indirect attribution (productivity tools, engagement features), revenue attribution requires more inference but the cost per request side of the equation is the same.
What is the cadence for cost per request review?
Daily monitoring in engineering. Monthly review in product. Quarterly review in finance. Different stakeholders need the data at different cadences for different decisions. Sources: - A16Z, "The State of AI Infrastructure 2024" - Flexera, "2024 State of the Cloud Report"