The Trustworthy Demo
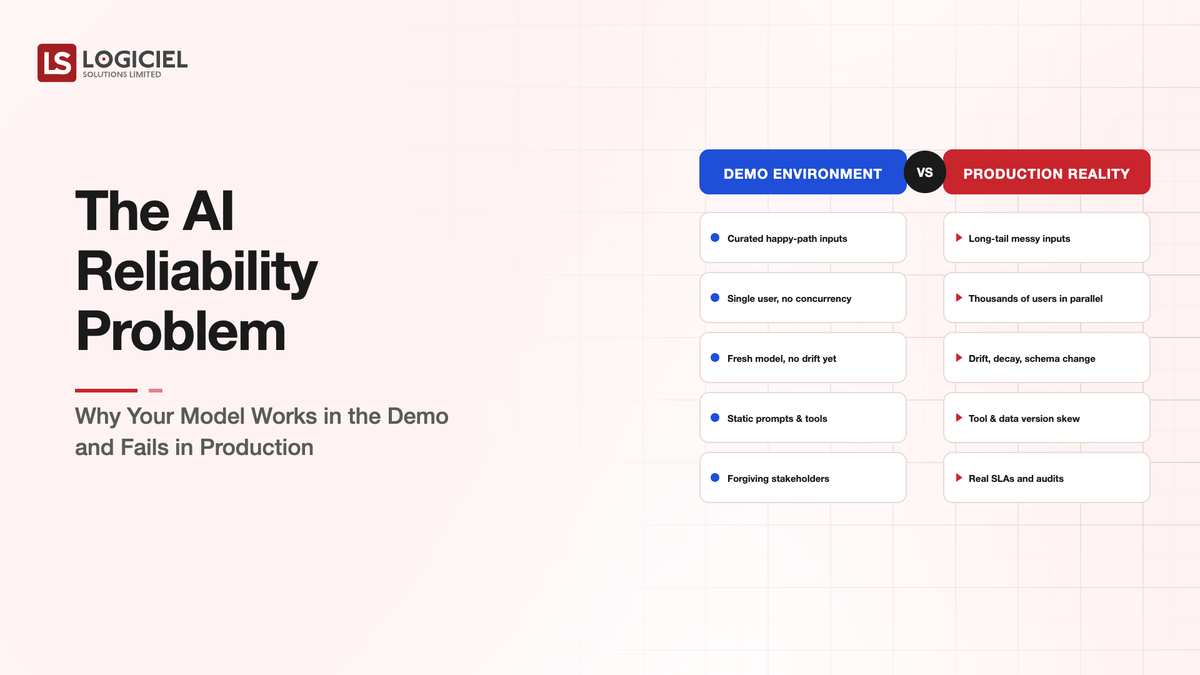
Demos work because everything about a demo is rigged in favor of the demo. The inputs are curated. The environment is controlled. The audience is forgiving. The output is selected after the fact if necessary. None of these conditions hold in production. The reliability gap that emerges between a demo and the same system serving real users has predictable causes, and the predictability is useful.
NIST's AI Risk Management Framework, in its 2024 update, identifies three categories of failure that account for most production reliability problems (NIST, "AI Risk Management Framework 1.1," 2024). The categories are useful because they tell engineering teams what to test for before the production launch rather than during the first production incident.
If your demo went well and you are about to launch, the question worth answering is which of the three failure categories is most likely to show up first.
The Three Reasons Demos Lie
NIST's three categories are distribution shift, evaluation gap, and operational drift. They are not equally common. They are not equally easy to detect. Knowing the differences shapes what testing actually catches problems.
Distribution shift is the gap between the inputs the model was trained or prompted on and the inputs it encounters in production. Demo inputs are usually closer to training distribution than production inputs are. A model that performs well on demo data may perform 20-40 percent worse on representative production data, with the gap concentrating in specific subsets that the demo did not include.
Evaluation gap is the difference between what the demo measured and what production users care about. Demos often measure narrow accuracy on a small sample. Production users care about consistency, response time, edge case handling, and the absence of specific bad behaviors. A model can score well on the demo metrics and badly on the user metrics.
Operational drift is the change in model behavior between when the demo was recorded and when the production system runs. Provider model updates, prompt changes, retrieval pipeline modifications, integration changes can all shift behavior. The model that demoed cleanly six weeks ago is not necessarily the same model running today.
Each category has different countermeasures. Distribution shift needs production-representative testing. Evaluation gap needs user-aligned metrics. Operational drift needs continuous monitoring. Skipping any one of these leaves a class of failures undetected.
What Production-Representative Testing Means
The countermeasure for distribution shift is testing on inputs that match production distribution. The detail that matters is what "match production distribution" means.
It does not mean using random samples of historical user inputs. Random samples skew toward common patterns and miss the long tail where most failures live. It does not mean adversarial inputs designed by engineers. Engineers think of failures differently from how users actually trigger them.
It does mean: stratified samples covering high-traffic intents, known edge cases, customer-reported failures from any prior version, inputs from underrepresented user segments, and inputs that have shifted from any pre-launch baseline. The eval set is constructed deliberately and updated continuously.
Teams that build this kind of eval set typically find their first production version performs 15-30 percent worse than the demo number on the matched eval. The discovery is uncomfortable in development and prevents the discovery being made by customers in production.
The Evaluation Gap That Surprises Teams
Evaluation gap is the most underestimated of the three categories. Teams confidently report evaluation results that do not reflect what users actually experience.
The pattern is consistent. The team measures accuracy against a labeled test set. The model scores 87 percent. The team interprets this as 87 percent of users will be satisfied. Production launches. Customer satisfaction with the AI feature comes in at 64 percent.
The gap is not because the test set was wrong. The gap is because user satisfaction depends on more than answer accuracy. Response speed matters. Output format matters. Tone matters. Refusal patterns matter. Handling of ambiguous questions matters. Each of these is not captured by accuracy metrics. The combination is what produces the satisfaction score.
The fix is constructing evaluations that include the dimensions users actually care about, not just the dimensions that are easy to measure. This is harder than accuracy testing because the metrics are partly subjective. Modern eval frameworks (LLM-as-judge, structured rubrics, user simulation) make this work feasible at scale.
The Operational Drift That Sneaks In
The third category, operational drift, has the longest tail because it accumulates after launch.
Provider model updates happen on schedules outside your control. OpenAI, Anthropic, Google, and AWS Bedrock all push updates within and between model versions. Some are explicit. Some are silent. Each one can shift behavior measurably.
Internal changes accumulate too. Prompt updates by the team, retrieval pipeline modifications, context construction changes, schema evolution in upstream data. Each individual change is small. The cumulative effect over six months can move the model meaningfully.
External data shifts also drift the model. The documents the retrieval system searches have evolved. The customer mix has changed. Product feature changes have changed what users ask about.
The countermeasure is continuous eval running against production traffic with alerts on regression. The first hour of operational drift is detectable if the eval is running. The 200th customer complaint is the alert if the eval is not running.
What This Looks Like at a Practitioner Level
A team operating an AI feature in production at production-grade has three pieces of infrastructure running continuously.
A representative eval set running pre-deploy, blocking deploys that regress meaningfully.
A user-aligned eval running on production samples, alerting on satisfaction-correlated metric drops.
A drift monitor watching provider model updates, internal prompt changes, and data distribution shifts, prompting eval runs when potentially significant changes occur.
Each component is engineered work. The combination converts the demo-to-production gap from a surprise that emerges into a managed risk that the team operates within.
What Logiciel Does Here
Logiciel works with engineering teams whose AI features have shown post-launch reliability gaps that demo-stage testing did not catch. The work is structured around the three failure categories with priority on whichever one is producing the most production incidents.
The AI Reliability Framework covers the broader four-surface observability model that supports continuous eval. The AI Testing and QA Automation framework covers the inverted-pyramid testing approach that addresses the evaluation gap specifically.
A 30-minute working session is enough to identify which of the three failure categories is most active in your current production behavior.
Frequently Asked Questions
Which failure category is most common at launch?
Distribution shift is the most common failure at launch because the demo and the production environment differ most when production traffic first arrives. Operational drift accumulates over months. Evaluation gap shows up in the first weeks of production user feedback.
How do I build a production-representative eval set if I have not launched yet?
Use the closest available approximation. Customer support transcripts, search logs, user research interviews, pilot user data. The set is imperfect at launch and improves with real production traffic. Imperfect is meaningfully better than uniform random samples.
How do I measure user-aligned metrics if my product is pre-launch?
Synthesize them from the user research data you have. What do users say constitutes a good answer. What do they flag as bad. Build rubrics around those criteria. The synthesized metrics are inferior to real user metrics and superior to no user-aligned metrics.
How often should I run the continuous eval?
Daily for high-traffic features. Weekly for lower-traffic ones. The cadence should be tight enough that operational drift is caught within a sprint rather than within a quarter.
What about the case where the demo really did represent production well?
It happens. When it happens, the production reliability looks identical to the demo. The presence of the three failure categories is not universal. Their potential presence is what justifies the testing discipline, even when the discipline confirms there are no problems. Sources: - NIST, "AI Risk Management Framework 1.1," 2024 - MIT Sloan, "Closing the AI Reliability Gap," 2024