Your dashboards are live.
Your pipelines are running.
However, your stakeholders still don’t have confidence in the data.
This is a frustrating reality for data leaders.
Often there is nothing wrong with the pipelines or tools; the problem is there are no metrics available which can verify the reliability of the system.
This is the point at which data infrastructure strategy becomes quantifiable.
As a vice-president, lead, or director of data and data infrastructure strategies and responsible for scaling data infrastructure strategies, you are accountable for building systems and proving they work consistently at a scalable rate.
In this guide you will discover:
- Why most teams are unsuccessful in measuring their data infrastructure effectively
- The critical KPIs which matter most (e.g., reliability, scalability, trust)
- How to report on those metrics in a way that drives usage of and alignment on those metrics
Let’s look at why measurement fails.
RAG & Vector Database Guide
Build the quiet infrastructure behind smarter, self-learning systems. A CTO’s guide to modern data engineering.
Section 1: The Difficulty Most Teams Have with Measuring Their Data
Most teams have some sort of metrics they track; however, not many of them track the right metrics.
Common Ways Teams Fail
Example of common dashboard items:
- Total number of pipelines
- Query performance
- Usage of Tools
Although these metrics may be useful, they do not answer:
- Is the data reliable?
- Is it trustworthy by the stakeholders?
- Is the system improving?
Why Metrics for Data Infrastructure Strategy in 2026 Are More Challenging to Measure
Current systems include:
- Real-time data pipelines
- AI-powered workloads
- Distributed architectures
Therefore making it more difficult to measure.
Previously measured:
- Uptime Only
Currently measures:
- Freshness
- Correctness
- Lineage
- Utilisation

The Main Problem
Most teams measure activities instead of outcomes.
For example:
- The number of pipelines doesn’t equal reliability.
- The speed of query execution doesn’t equal the quality of data.
Meaning of Success
For VP/Head of Data, success is:
- The data is trusted by the stakeholders without needing validation.
- The early detection of an incident and the quick resolution of an incident.
- The ability for systems to be scaled without a degradation of performance.
A Scenario
A dashboard indicates a "100% success rate" for the pipelines.
However:
- The data is old
- The metrics differ
- The stakeholders do not use it
This is a failure in measurement.
Section 2: Preconditions: What needs to be in place before starting
Before you can create KPIs, you need to have the foundations established.
1. Define Ownership
Every dataset/pipeline must have an:
- Owner
- Define SLA’s
- Define the responsibilities
2. Establish Current Infrastructure
You need:
- Centralised data platform
- Pipeline orchestration
- Monitoring systems
3. Implement Data Contracts
Ensure the following:
- Schema consistency
- Predictability in changes
4. Get Stakeholders Aligned
Establish the following:
- What success means
- The metrics that are important
5. Define Reporting Cadence
Establish:
- Reports to be operationally produced each week
- Reports to be produced every month that are strategic in nature
6. Verify the Observability of the Data
Without observability it is impossible to reliably measure the KPI’s.
Section 3: Phase 1: Assess your current state
When you establish KPIs, you need to determine your current state.
1. Audit Existing Metrics
List out:
- What you currently are measuring
- How often you measure
- Who uses the metrics
2. Identify Gaps
Common gaps can include:
- Lack of freshness metrics
- Lack of metric’s for accuracy
- Lack of visibility within the lineage
3. Evaluate Reliability
Inquire:
- What is the frequency of pipeline failures?
- What is the efficiency of problem detection?
- What is the time it takes to resolve problems?
Review Data Flow
Understand:
- The origin of the data
- The manner in which it is transported
- Where problems are encountered
Prioritize Improvement
Focus on:
- The most impactful datasets
- The most critical pipelines
- The most valuable outputs
A detailed diagram showing metric gaps.
Section 4: Phase 2 Design of Final Measurement System
Define what should be measured.
1. Core KPI Definition
Data infrastructure strategy KPI definitions can be grouped into 4 categories:
- Reliability
- Observability
- Scalability
- Adoption
2. Reliability KPI Measurements
- Pipeline uptime
- Frequency of incident occurrence
- Mean time to repair (MTTR)
3. Observability KPI Measurements
- Data freshness
- Lineage coverage
- Alert validity
4. Scalability KPI Measurements
- Pipeline throughput during high activity levels
- Cost of query execution
- System throughput
5. Adoption KPI Measurements
- Total number of users
- Dashboard interaction
- Decision making based on data
6. Target Definitions
Example targets:
- 99.9% uptime
- Greater than 10 minutes between freshness and current time
- 50% reduction in incident frequency
The key takeaway is that the best KPIs should align with the company's goals, not with the performance of the system.
Section 5: Phase 3 Incrementally Building, Testing, And Deploying Measurement Systems
Measurement systems require careful deployment.
1. Start with Critical Systems
Target systems based on:
- High impact pipeline usage
- Core data usage
2. Create KPI Dashboards
Create a dashboard of:
- System health
- Trends
- Key metrics
3. Capture Data Automatically
Make sure that:
- Metrics are always recorded
- Manual data tracking is eliminated
4. Validate Metric Results
Make sure that:
- The metrics are accurate
- The metrics are relevant
- The metrics can be easily used
5. Share Results with Users
Make dashboards:
- Testable
- Easy to interpret
Iterate on Your Feedback to Refine and Improve
- Metrics
- Thresholds
- Reporting
Section 6: Measure Success and Re-evaluate
Measurement Continues to Evolve.
1. Identify Trends over Time
- Improvements
- Patterns
- Recurring Issues
2. Ensure Metrics Tied to Business Outcomes
- Metrics Reflect Real Impact
- Stakeholders Understand Value
3. Conduct Monthly Reviews
- Performance
- Issues
- Improvements
4. Change KPIs as Necessary
Evolving Systems Should Require Evolving Metrics.
5. Focus on Leading Indications
Track Early Warning Signs and/or Risks.
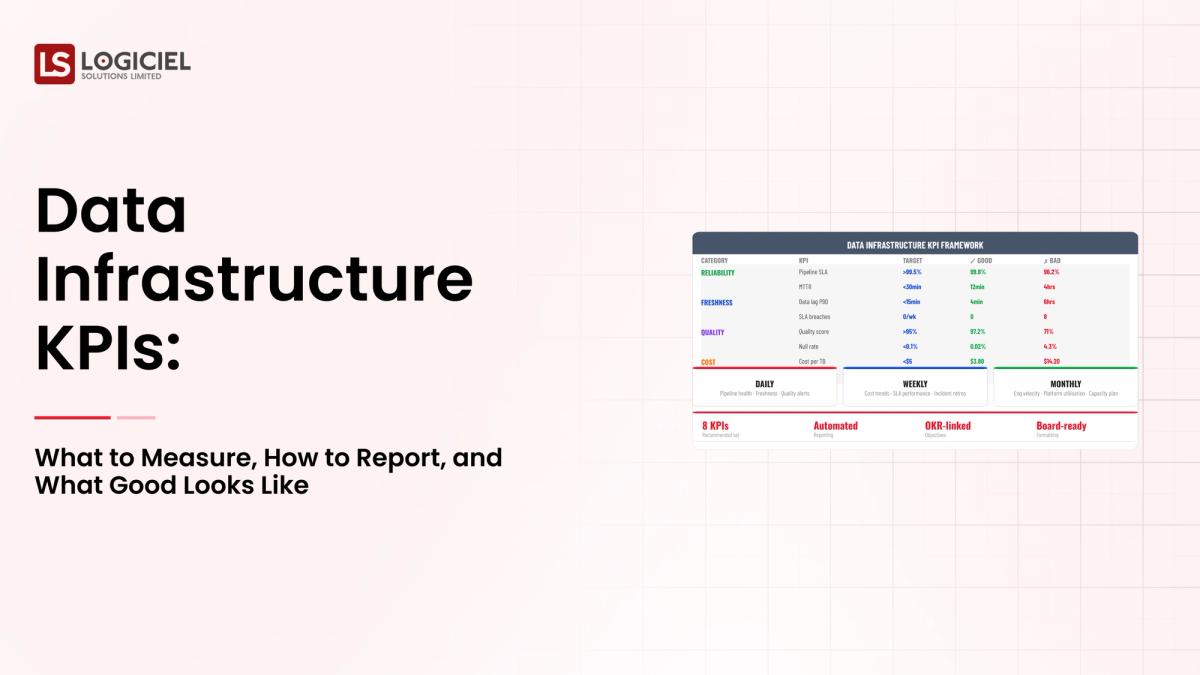
What Does Good Look Like - Sample KPI Framework
Sample 1:
Reliability
- 99.9% Uptime
- < 1% Failure Rate
Observability
- 100% Pipeline Monitoring
- < 5min Alert Response Time
Scalability
- Stable Performance at Double Load
- Controlled Cost Growth
Adoption / Usage
- 80% of Teams Use Single Source of Data
- Reduce Manual Reporting
AI – Powered Product Development Playbook
How AI-first startups build MVPs faster, ship quicker, & impress investors without big teams.
Call to Action
If you can’t measure it, you can’t improve it.
The Best Teams Do More Than Just Build Systems - They Measure, Validate and Continue to Iterate and Improve.
Good Data Infrastructure Strategy Includes:
- Well Defined KPIs
- Transparent Reporting
- Ongoing Iteration
At Logiciel, We Work with Organizations to Develop KPI Frameworks That Enable Data Infrastructure to Become a Measurable, Reliable Asset.
If Your Team is Developing Data Systems Without Defined KPIs and Metrics You Are Doing So Without Any Visibility into the Systems You Are Developing.
Contact Logiciel to Explore How AI First Engineer Teams Can Help You Design and Measure Your Data Infrastructure Such That It Makes a Real But Measurable Impact to Your Business.
Frequently Asked Questions
What are KPIs for Data Infrastructure?
KPIs Monitor Performance, Reliability and Impact of Data Systems to Ensure They Meet Business Needs.
Why Are KPIs Important to a Data Infrastructure Strategy?
KPIs Help Teams Understand System Performance and Identify Issues, Improve Reliability and Have Trust in Data.
What are the Most Important KPIs to Track?
Sample KPIs Include Pipeline Uptime, Data Freshness, Incident Frequency, and User Adoption.
How Often Should KPIs be Reviewed?
Operational KPIs Should be Monitored Daily or Weekly and Strategic KPIs Monthly.