Data observability refers to the ability to monitor, understand and maintain the health of your data systems by utilizing a number of indicators.
Data observability differs from regular monitoring by providing information about the behavior of the data component of a system and not just how well the surface metrics show success.
If you are a team leader of data engineering, you are probably used to having a stakeholder come to you with a question about a number, and all of the dashboards are saying that number is 'good.'
All of the pipelines also show that they are in a 'healthy' state and no alerts have been created. However, you can feel that something is not quite right.
This is the discomforting fact of where we are today with our data industry.
We use dashboards to provide visibility for what has happened, but we do not have any way to validate the accuracy of the underlying data.
As the use of cloud service platforms, real-time pipeline processes, and machine learning technology increase, the gap between reliable data and visibility into how that data was produced is going to get bigger.
This is why data observability is essential for data teams.
Data observability also provides proactive measures to help a data team find anomalies in data quickly, figure out how the problem originated and ultimately maintain the reliability of data in a scalable manner.
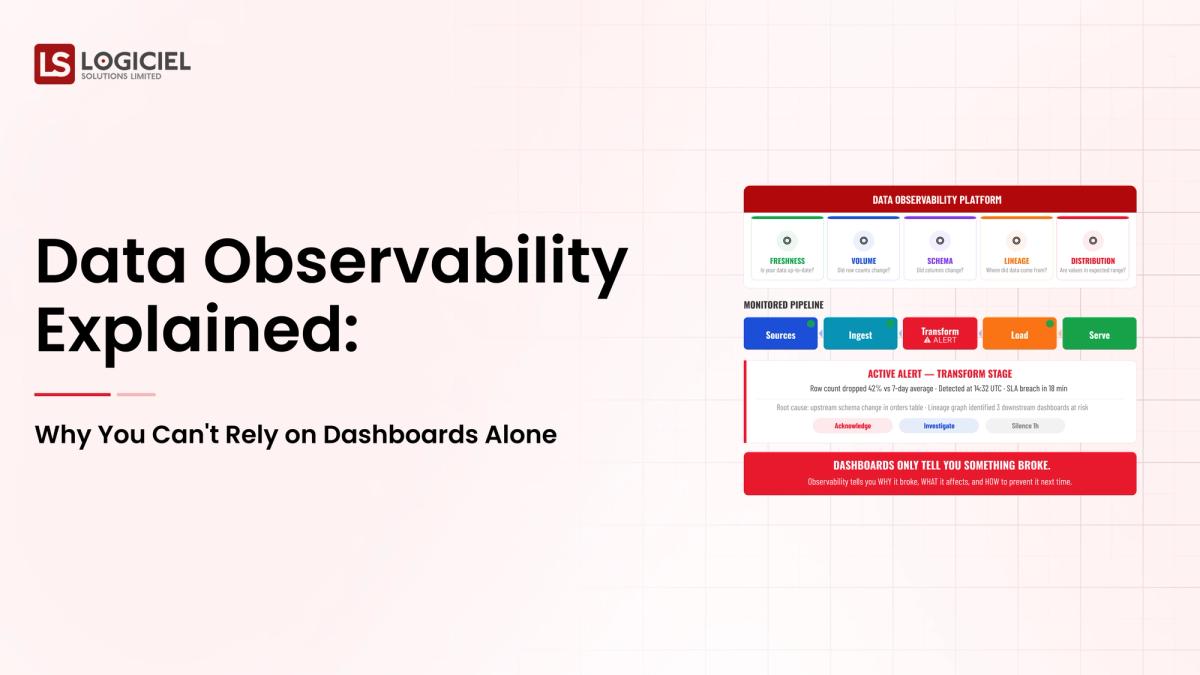
Core Signals of Data Observability
Modern platforms track:
- Freshness: Is data arriving on time?
- Volume: Are record counts within expected ranges?
- Schema: Have structures changed unexpectedly?
- Distribution: Are values statistically consistent?
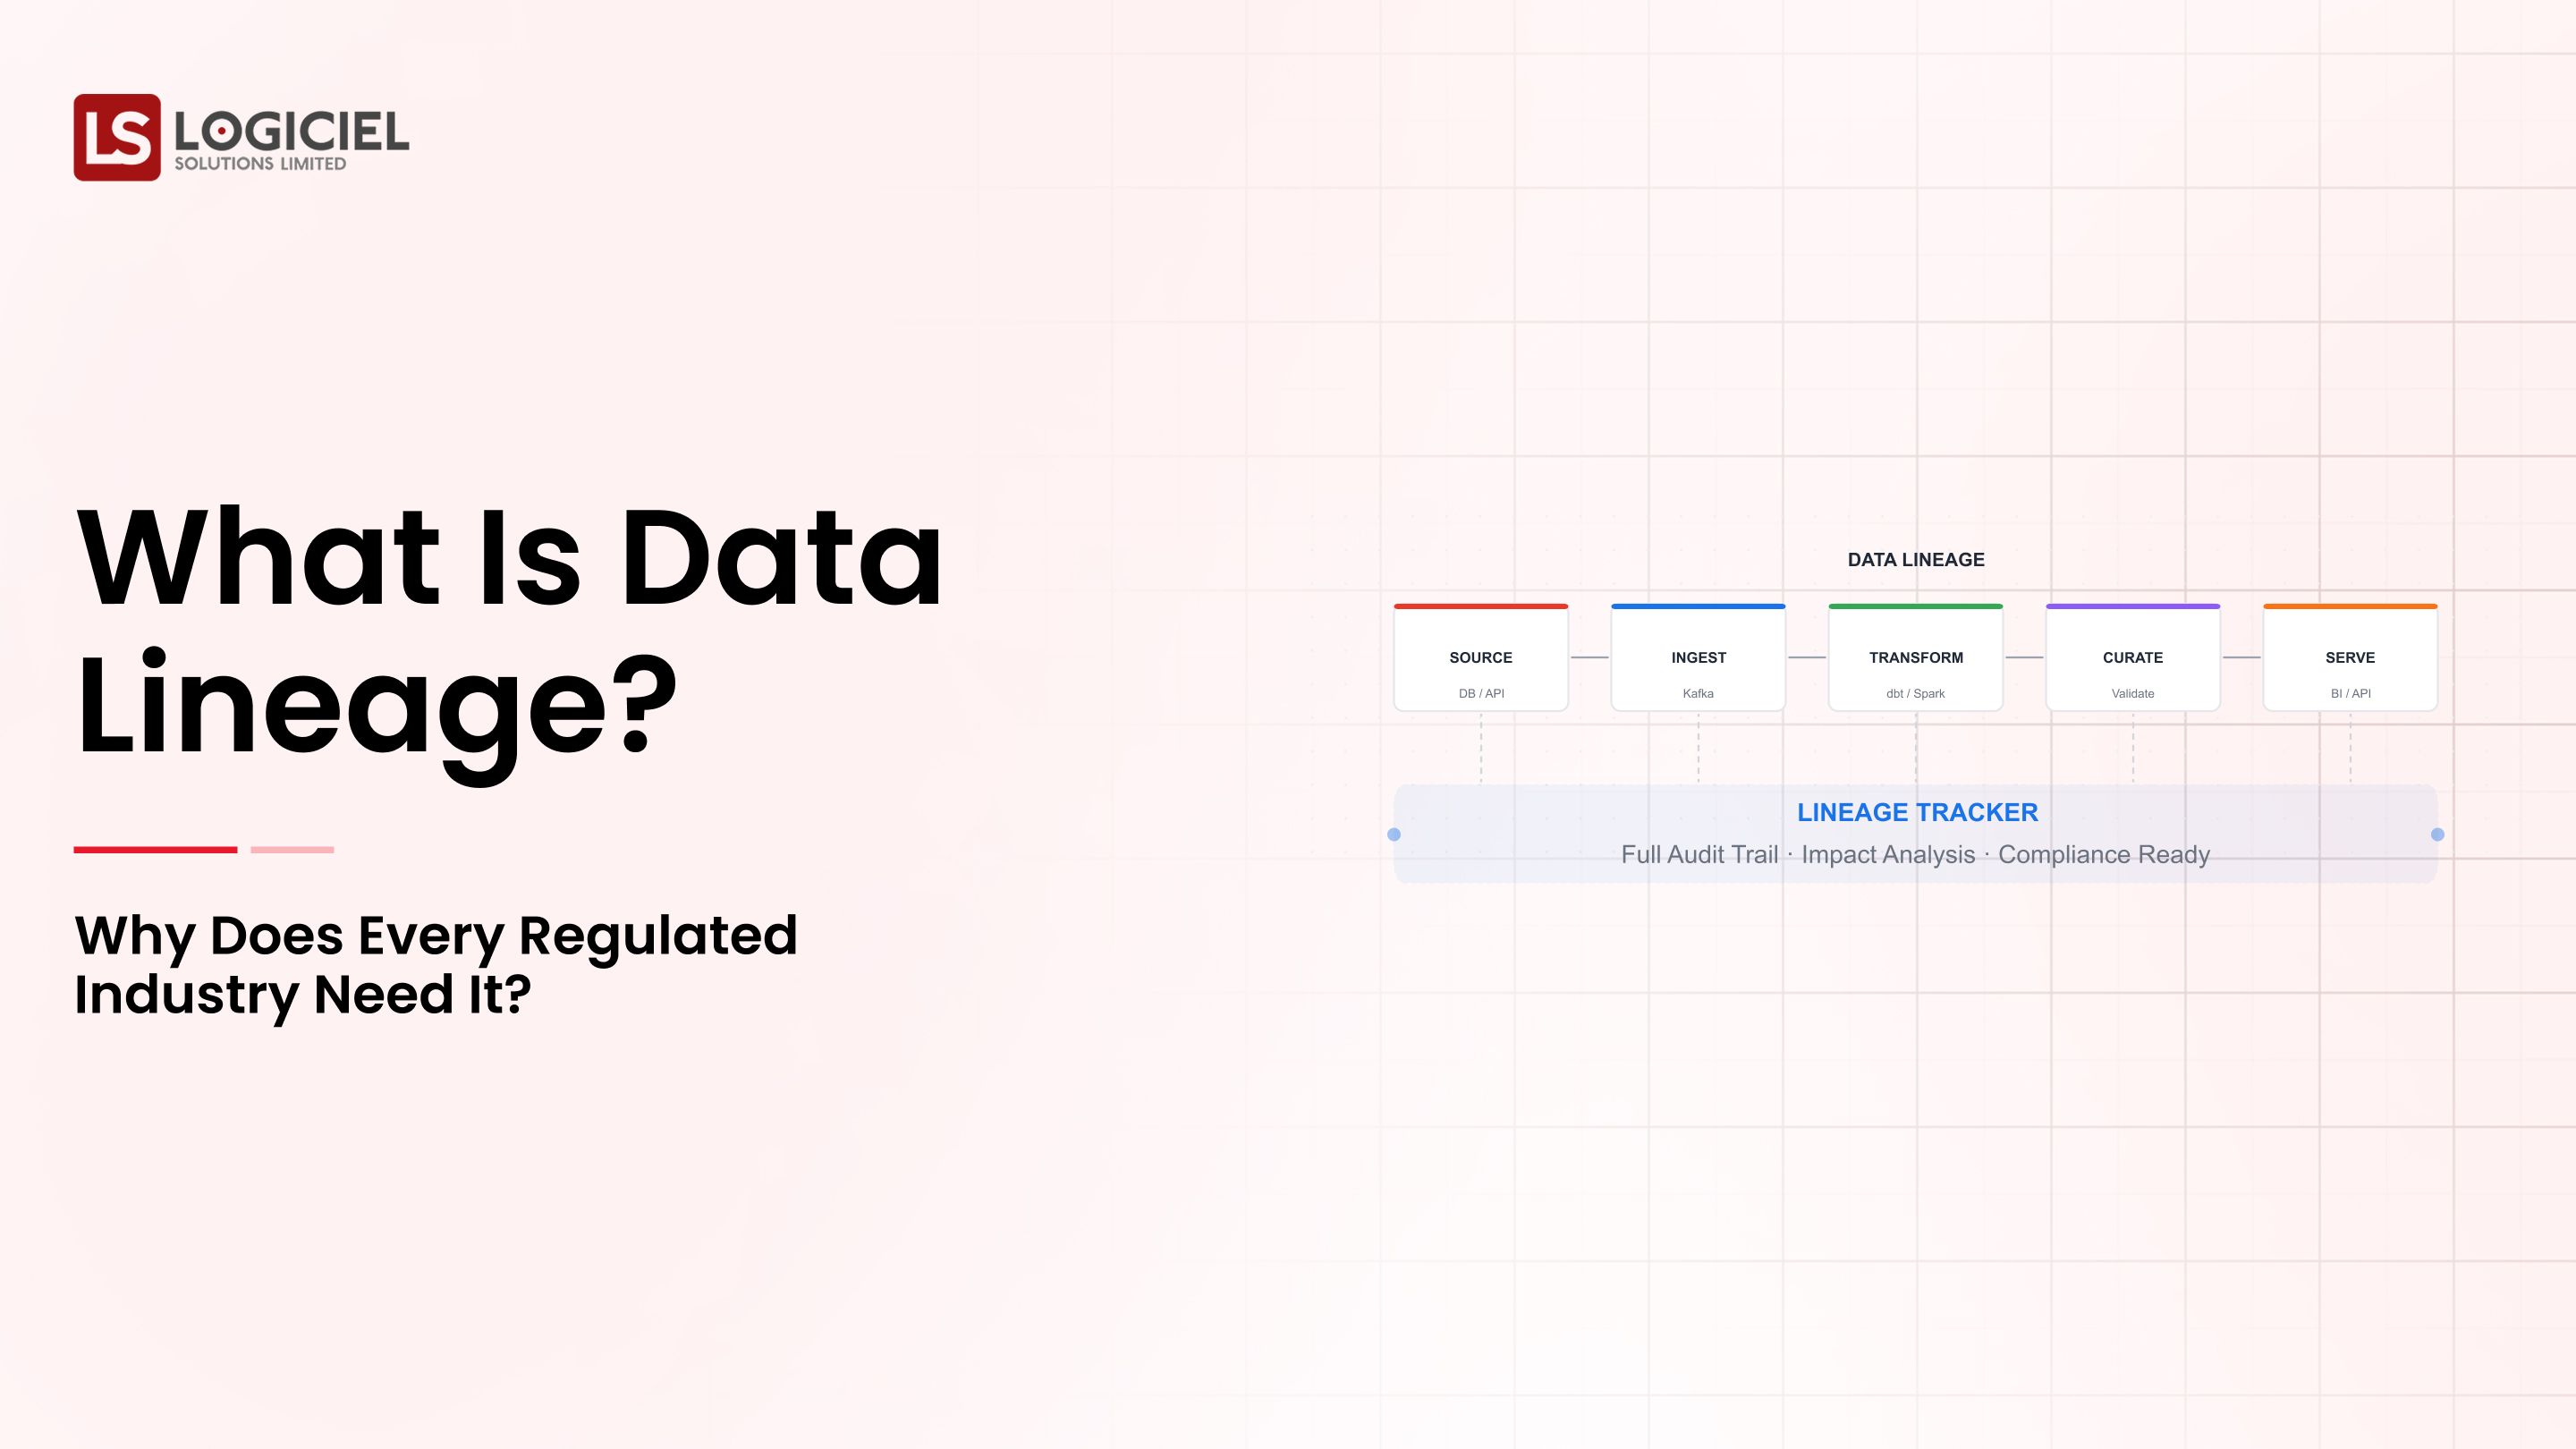
- Lineage: Where does the data originate and flow?
These signals help teams identify issues before they have an effect on any systems downstream.
Importance of Data Observability
Instead of asking "What is data observability?" it is now asking "Why is data observability important?"
Because:
- Data pipelines are becoming more complex
- Failures propagate silently through systems
- Decisions are reliant on real-time data
Without observability, teams spend time manually debugging and reactively fixing issues.
The take away is that data observability changes data engineering from a reactive maintenance model to a proactive reliability model.
Why Dashboards Alone Aren’t Sufficient
Dashboards are important, but they were never intended to provide assurance on the reliability of your data.
They represent the end state, not the point of control.
The Main Problem
Dashboards are only as good as the upstream data being correct.
If there is a break in the pipeline, then the dashboard will be displaying wrong information without knowledge of or indication as to why it is reflecting that information.
Key Limitations
Those Metrics Are Results, But They Don’t Tell You About The Health Of Your System
At the end of the day, dashboards display metrics such as:

They however will:
- Not display pipeline delays
- Not display schema changes
- Not display missing data
Dashboards Cannot Detect Issues That You Have Not Predetermined
Dashboards require determination of success through the definition of pre-existing metrics.
Anomalies that are unexpected will not be detected on a dashboard because they fall outside of its scope.
No Inherent Root Cause Analysis
When something breaks in the data engineering process, engineers must:
- Perform manual lineage tracing
- Check logs across systems for the same execution
- Re-run the data pipeline
Each of these lengthens the time it takes to respond to the issue.
Feedback Loop Has A Delay
By the time a dashboard displays data that is incorrect, the decision based on that incorrect data has already negatively impacted the organization.
Scenario in a natural setting
A data engineering team is dependent on dashboards to observe their data.
If an upstream schema change occurs to a table or a view, the transformation logic can break unexpectedly, but the dashboard will continue to present incomplete data from the previous version of the table or collection.
It is only after the stakeholders become aware of the problem from other sources that it is uncovered.
What is the difference between data observability and data quality?
Data observability will allow you to find problems in your system before an issue becomes visible in the dashboard.
Takeaway: Dashboards are for visualization and not for reliability of data.
Transformation of Monitoring to Data Observability: An Essential Transition
Recognizing this shift is vital for today’s data teams.
The Differences Between Monitoring and Data Observability
CapabilityMonitoringData ObservabilityFocusKnown IssuesUnknown IssuesAlertsStatic ThresholdsDynamic PatternsScopeMetricsComplete PipelineDebuggingManualAutomated Insight
Why this difference is important
Monitoring answers: What was the failure?
Data observability answers the following questions:
- Why did it happen?
- What caused it?
- What systems were impacted?
Both of these will allow for better detection and resolution speeds.
For example:
A traditional system provides monitoring to detect failure after it has happened but through observability you can detect anomalies prior to the detection of the restrictions in the transformation process.
The Takeaway: Observability will provide the prevention of incidents vs. the cure to incidents.
The Key Components of a Data Observability Tool
When evaluating the right data observability platform, evaluate by capabilities and not just by features.
Automated Anomaly Detection
Ability to detect deviations without predefined rules.
Examples of deviations:
- Sudden drop in data volume
- Spike in the number of null values
- Changes in Data type
End-to-End Data Lineage
Ability to track data from source system to transformation to dashboard.
When you have end-to-end data lineage you have visibility to implement data observability within your pipeline.
Schema Change Detection
Detects:
- Change in Column structure
- Data type mismatch
- Structural changes
Data Quality Assessment
Verifying:
- Accuracy
- Completeness
- Consistency
Data Observability Diagnostics
Diagnostics capabilities of the overall data observability platform.
Integrating with Contemporary Stack
Compatibility:
- Snowflake Data Tracking
- Databricks Data Tracking
- Dbt Pipeline Monitoring
- Airflow Management
- Data Observability Tools
- Monte Carlo Data Monitoring
- Datadog Metrics Tracking
- Collibra Data Assessment and Monitoring
Each application monitors a different part of the pipeline.
Main Point: Use systems that offer overall monitoring, not just individual components.
Data Tracking Implementation in Your Pipeline
A Data Engineering Lead converts the strategy into actions.
Phase 1: Identify
Identify:
- All data sources
- Pipelines
- Transformations
- End Users
You will have a framework for tracking your data.
Phase 2: Identify Important Pipelines
Identify Pipelines Important to:
- Revenue-producing Data
- Consumer Applications
- Machine Learning Pipelines
Phase 3: Establish Monitoring Metrics
Monitor:
- Freshness
- Volume
- Integrity
- Source Distribution
These indicators will provide an early warning system.
Phase 4: Implement Tracking Tools
Identify and use tools that integrate into your processing framework.
Example:
- Ability to track and process data from Snowflake
- Tracking of data through multiple ETL operations
Phase 5: Implement Automated Workflows and Alerts
Link Workflows and Alerts with:
- Slack
- Incident Response Management Systems
- Ticketing Systems
Phase 6: Build an Organizational Culture of Data Integrity
Treat data issues like a problem with a system.
Measuring:
- Time from Detection to Troubleshooting
- Time from Troubleshooting to Resolution
Example: Engineering team established tracking system resulting in a 40% reduction in debugging time due to immediate identification of the cause of the incident.
Main Point: Developing an effective system for monitoring data requires both monitoring tools and the utilization of proper processes.
Advantages for Data Engineering Professionals
Data Engineering Professionals can see the benefits through quantification.
- Improved Debugging Efficiency
Automated insights reduce the need for users to manually investigate - Greater Trust in Data
As a result of confidence in the source and quality of data used to make decisions - Decreased Operating Expenses
As the number of incidents and amount of lost time are reduced - Accelerated Development of Engineering Processes
Engineers find themselves with a higher proportion of time spent creating instead of troubleshooting - Improved Applicability of AI Models
Using observability, organizations are gaining greater accuracy from data gathered from other resources
Ultimately, this will be one of the most important factors in implementing AI successfully within an organization.
Key Point: data observability is essential for improved organizational performance.
Distinction Between Data Observability vs Data Quality
According to search engines, the sixth most frequent search result is related to the difference between data observability and data quality.
When Considering Data Quality
For the purpose of assessing overall data quality, records must be assessed for:
- Accuracy
- Completeness
- Consistency
To assess data observability
Systems must be assessed for:
- Health
- Distribution
- How to locate problems within the system or the flow of information
Interrelationship Between Data Quality vs Data Observability
Data quality can be considered one aspect of observability; without observability, an organization may experience challenges identifying quality deficiencies and identifying the source of the deficiency.
Key Point: observability supports the creation of scalable data quality.
Evaluating Data Observability Solutions
The frequent question from teams, "Which company is the best at offering data observability?" can be answered only within the context of your organizational stack and use case.
The process of evaluation should consist of:
- Integrating with cloud environments
- Real-time anomaly detection
- Full lineage
- Ease of integration/installation
Tool Comparison Example
ToolFeaturesMonte CarloAll-in-one observabilityDatadogInfrastructure + Data MonitoringCollibraGovt. + Quality Assessment
What your intentions are in regard to your organization will determine what your organization's optimal data observability solution will be.
Key Point: selection of a singular optimal solution cannot be achieved; but there are solutions which meet each organization's unique requirements.
Data Observability and AI in Organizing Information
As data teams strive to become AI based organizations, observability will play a crucial role.
Why AI Systems Respond Quickly to Change
AI models operate using various methods of continuous data flow; data flow can be added and updated in real-time. However, small errors throughout this process can lead to:
- Model drift or change in a model's predictions over time
- Bias where all of the training data used is from one source and does not represent the actual situation
- The ability to predict incorrectly
- Unforeseen trends and emerging markets
Our ability to see our machine learning pipelines:
- Rapidly detecting abnormalities in real-time
- Unified observability of our data and infrastructure
According to some industry leaders and surveys, organizations who are putting money into observability have dramatic increases in the reliability of their overall systems.
So the simple takeaway is that Data Observability is the key to scaling out AI.
Frequently Asked Questions
What is data observability in layman's terms?
Why is data observability important?
What are top data observability tools for cloud environments?
How do I implement data observability in my pipeline?
What is the difference between data observability and monitoring?
Final Thoughts - Not Just Dashboards
Dashboards are helpful. They provide visibility. They provide intelligence.
But they do not guarantee trustworthy intelligence.
For the leaders of your data engineering teams, the greatest challenge is not creating dashboards; it is to ensure that each number presented in your dashboards is a reliable number.
The ability to do this relies on data observability.
Logiciel's Perspective
At Logiciel Solutions, we assist data engineering teams in building AI-first systems that incorporate observability within architectural design rather than at a later time.
We use intelligent automation, visibility at the system level, and current data engineering technologies to ensure that your data pipelines are reliable, scalable, and capable of handling the requirements of AI-driven workloads.
If your dashboards appear correct but feel incorrect, it may be time to move away from visibility towards real observability.
Contact Logiciel to learn how we can assist you in engineering trustworthy data systems.