There is an ESG report due for your building portfolio, and assembling the energy numbers is a quarterly scramble: utility bills in different formats, meter data from different systems, square footage from a spreadsheet someone maintains, all manually reconciled into a benchmark that nobody fully trusts. The energy benchmarking that should be a pipeline is a recurring manual project, and the ESG report it feeds inherits its inconsistency.
This is more than a reporting chore. It is energy benchmarking without a data pipeline.
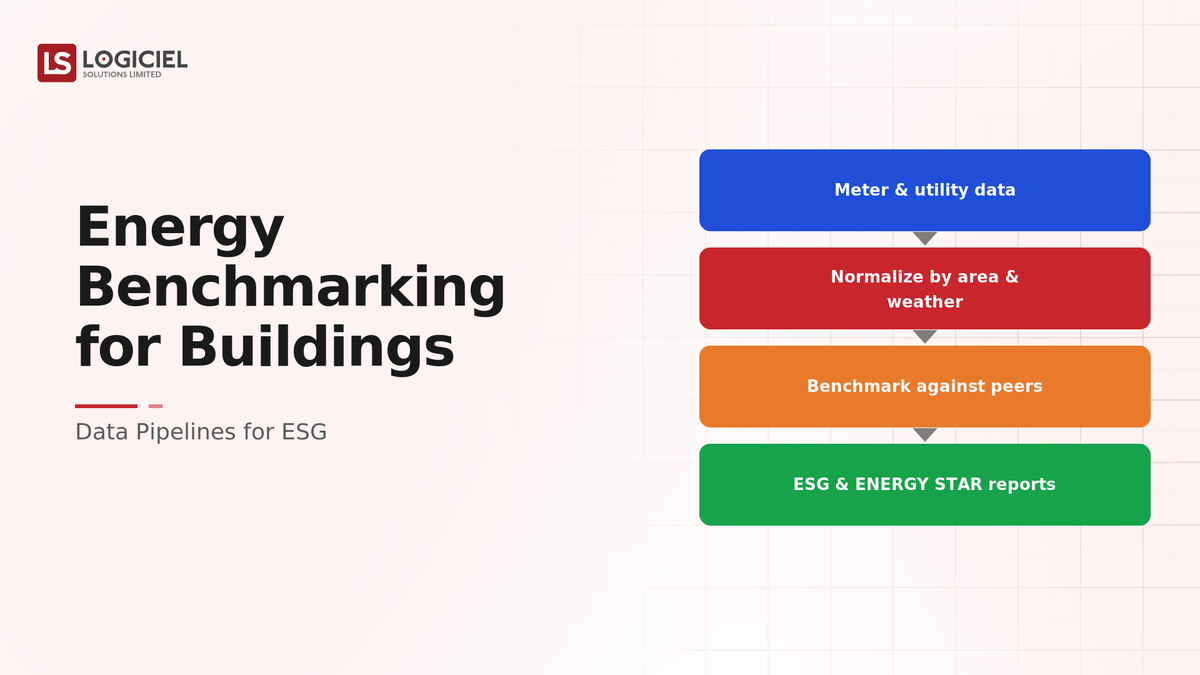
Energy benchmarking for buildings is more than collecting consumption numbers. It is a data pipeline that ingests meter and utility data across formats and sources, normalizes it for fair comparison (by area, weather, use), computes benchmarks consistently, and produces the auditable, repeatable output ESG reporting requires, so benchmarking is a pipeline that runs rather than a quarterly scramble that is re-done.
However, many organizations assemble benchmarks manually each reporting cycle and discover that ESG reporting needs consistent, auditable, repeatable data that a manual scramble cannot reliably provide.
If you are a sustainability or data leader handling building energy data, the intent of this article is:
- Define what an energy benchmarking pipeline requires
- Walk through ingestion, normalization, and benchmarking
- Lay out the controls ESG reporting needs
To do that, let's start with the basics.
Why Boards Reject Infrastructure Spending Cases
Inside a financial-frame business case that turned a 14-month stall into a 45-minute board approval.
What Is an Energy Benchmarking Pipeline? The Basic Definition
At a high level, an energy benchmarking pipeline is an automated data pipeline that ingests building meter and utility data from varied sources, normalizes it for fair comparison, computes benchmarks consistently, and produces auditable, repeatable output for ESG reporting.
To compare:
If manual benchmarking is reconciling receipts by hand each quarter, a pipeline is an accounting system that ingests transactions continuously and produces consistent statements on demand. The receipts are the same; the pipeline makes the output consistent, auditable, and repeatable.
Why Is an Energy Benchmarking Pipeline Necessary?
Issues that a benchmarking pipeline addresses or resolves:
- Ingesting varied meter and utility data consistently
- Normalizing data for fair comparison across buildings
- Producing the auditable, repeatable output ESG reporting requires
Resolved Issues by a Benchmarking Pipeline
- Replaces the quarterly manual scramble with a pipeline
- Normalizes for fair, comparable benchmarks
- Produces consistent, auditable ESG-ready output
Core Components of an Energy Benchmarking Pipeline
- Ingestion of meter and utility data across formats and sources
- Normalization by area, weather, and use
- Consistent benchmark computation
- Auditable, repeatable output
- Data quality and governance for reporting
Modern Energy Benchmarking Tooling
- Utility and meter data ingestion and APIs
- Normalization for area, weather, and building use
- Benchmarking standards and methodologies
- Data quality and validation
- Auditable reporting outputs
These tools support benchmarking; the discipline is the pipeline that makes the output consistent and auditable.
Other Core Issues They Will Solve
- Support recurring ESG reporting without re-doing the work
- Enable fair comparison across a building portfolio
- Provide an audit trail for reported figures
Importance of Energy Benchmarking Pipelines in 2026
A benchmarking pipeline matters more as ESG reporting demands rise. Four reasons explain why it matters now.
1. ESG reporting is recurring and scrutinized.
Energy figures are reported regularly and increasingly scrutinized. A manual scramble cannot reliably provide consistent, auditable data.
2. Fair comparison requires normalization.
Comparing buildings of different sizes, climates, and uses requires normalization. Raw consumption is not comparable.
3. Auditability is expected.
Reported figures must be traceable and repeatable. A manual process that cannot reproduce its numbers fails that bar.
4. The data is varied and growing.
Meter and utility data come in many formats from many sources, and the volume grows. A pipeline handles it; manual assembly does not scale.
Traditional vs. Pipeline Benchmarking
- Quarterly manual scramble vs. an automated pipeline
- Raw consumption vs. normalized, comparable benchmarks
- Inconsistent, hard-to-audit output vs. consistent, auditable output
- Re-done each cycle vs. runs repeatably
In summary: An energy benchmarking pipeline ingests, normalizes, and computes benchmarks consistently, producing auditable, repeatable ESG-ready output rather than a manual scramble.
Details About the Core Components of an Energy Benchmarking Pipeline: What Are You Designing?
Let's go through each layer.
1. Ingestion Layer
Getting the data in.
Ingestion decisions:
- Meter and utility data across formats and sources
- Automated ingestion, not manual collection
- Handling of varied data quality
2. Normalization Layer
Making data comparable.
Normalization decisions:
- Normalization by floor area
- Weather normalization for climate
- Adjustment for building use
3. Benchmark Layer
Computing the metrics.
Benchmark decisions:
- Consistent benchmark methodology
- Standards-aligned where applicable
- Comparable across the portfolio
4. Output Layer
Producing ESG-ready results.
Output decisions:
- Auditable, repeatable output
- Traceability to source data
- Reporting-ready formats
5. Quality Layer
Ensuring reliability.
Quality decisions:
- Data validation and quality checks
- Anomaly detection in consumption
- Governance for reported figures
Benefits Gained from a Benchmarking Pipeline
- Benchmarking that runs repeatably instead of being re-done
- Fair, normalized comparison across the portfolio
- Auditable, consistent output ESG reporting can rely on

How It All Works Together
The pipeline ingests meter and utility data across formats and sources automatically, handling varied data quality rather than collecting it by hand. It normalizes the data for fair comparison, by floor area, weather, and building use, so buildings of different sizes, climates, and uses can be compared. Benchmarks are computed with a consistent, standards-aligned methodology across the portfolio. The output is auditable and repeatable, traceable to source data and in reporting-ready formats. Data validation, anomaly detection, and governance ensure the figures are reliable. When the ESG report is due, the benchmark data is produced by a pipeline that runs, with an audit trail, rather than reconstructed in a quarterly scramble.
Common Misconception
Energy benchmarking is mostly about collecting the consumption numbers.
Collecting numbers is the start. The work is normalizing them for fair comparison and producing consistent, auditable, repeatable output for ESG reporting. Raw consumption is not comparable across buildings, and a manual scramble cannot reliably provide the auditable, repeatable data reporting requires.
Key Takeaway: Benchmarking is normalization and repeatability, not just collection. The pipeline makes the output comparable and auditable, which is what ESG reporting needs.
Real-World Benchmarking Pipeline in Action
Let's take a look at how a benchmarking pipeline operates with a real-world example.
We worked with an organization assembling energy benchmarks manually each cycle, with these constraints:
- Replace the quarterly scramble with a pipeline
- Normalize for fair comparison
- Produce auditable, repeatable ESG output
Step 1: Automate Ingestion
Get the data in reliably.
- Meter and utility data ingested across sources
- Automated, not manual
- Varied data quality handled
Step 2: Normalize for Comparison
Make buildings comparable.
- Normalization by area
- Weather normalization
- Use adjustment
Step 3: Compute Benchmarks Consistently
Apply a consistent methodology.
- Standards-aligned where applicable
- Consistent across the portfolio
- Repeatable computation
Step 4: Produce Auditable Output
Make it reporting-ready.
- Auditable, repeatable output
- Traceable to source
- Reporting formats
Step 5: Ensure Quality
Make figures reliable.
- Data validation and quality checks
- Anomaly detection
- Governance for reported figures
Where It Works Well
- Automated ingestion across varied sources
- Normalization enabling fair comparison
- Consistent, auditable, repeatable output for ESG
Where It Does Not Work Well
- A quarterly manual scramble re-done each cycle
- Raw consumption compared without normalization
- Output that cannot be audited or reproduced
Key Takeaway: The energy benchmarking ESG reporting can rely on is the one produced by a pipeline that ingests, normalizes, and computes consistently with auditable output, not the manual scramble re-done each cycle.
Common Pitfalls
i) Manual assembly each cycle
Reconstructing benchmarks by hand each reporting cycle is inconsistent and hard to audit. Build a pipeline that runs repeatably.
- Automate ingestion
- Normalize consistently
- Produce auditable output
ii) Comparing raw consumption
Buildings differ in size, climate, and use. Raw consumption is not comparable. Normalize before benchmarking.
iii) Non-auditable output
ESG figures must be traceable and reproducible. Output that cannot be audited fails the reporting bar.
iv) Ignoring data quality
Varied meter and utility data carries quality issues. Validate and detect anomalies so figures are reliable.
Takeaway from these lessons: Most benchmarking pain traces to manual assembly and missing normalization, not to the data. Build apipeline, normalize, and make output auditable.
Energy Benchmarking Best Practices: What High-Performing Teams Do Differently
1. Build a pipeline, not a scramble
Automate ingestion and computation so benchmarking runs repeatably rather than being re-done each reporting cycle.
2. Normalize for fair comparison
Adjust for floor area, weather, and building use so buildings of different sizes, climates, and uses are comparable.
3. Compute benchmarks consistently
Apply a consistent, standards-aligned methodology across the portfolio and across cycles.
4. Make output auditable and repeatable
Produce ESG-ready output traceable to source data and reproducible, since reporting demands it.
5. Ensure data quality
Validate data and detect anomalies so reported figures are reliable and governed.
Logiciel's value add is helping sustainability and data teams build energy benchmarking pipelines that ingest, normalize, and compute consistently with auditable output, so ESG reporting runs on a pipeline rather than a quarterly scramble.
Takeaway for High-Performing Teams: Focus on normalization and repeatability. Energy benchmarking for ESG is a pipeline that produces comparable, auditable, repeatable output, not a manual collection re-done each cycle.
Signals You Are Benchmarking Energy Correctly
How do you know the benchmarking is sound? Not in whether numbers are collected, but in whether the output is comparable and auditable. Below are the signals that distinguish a pipeline from a scramble.
It runs repeatably. The team produces benchmarks from a pipeline that runs, not a manual reconstruction each cycle.
Data is normalized. Buildings are compared after normalization for area, weather, and use, not on raw consumption.
Output is auditable. Reported figures are traceable to source and reproducible.
Data quality is checked. The team validates data and detects anomalies so figures are reliable.
ESG reporting is reliable. The report draws on consistent pipeline output rather than an inconsistent scramble.
Adjacent Capabilities and Connected Work
This work does not exist in isolation. An energy benchmarking pipeline depends on, and feeds into, several adjacent capabilities. Building one without thinking about the others is the most common scoping mistake.
In most organizations, benchmarking shares infrastructure with the building and meter data systems, the data platform, and the ESG reporting process. It shares capacity with sustainability, data engineering, and the reporting teams. And it shares leadership attention with whatever the next ESG or data initiative is on the roadmap. Naming these adjacencies upfront helps the program scope realistically and helps leadership see the work as a portfolio rather than a one-off project.
The most common mistake in adjacent-capability scoping is treating each adjacency as someone else's problem. The meter and utility data sources are your problem to ingest. The normalization inputs like floor area are your problem. The ESG reporting consuming the output is your problem. Pretending otherwise pushes work to teams that did not plan for it, and the work returns to you later as an inconsistent or unauditable report. Own the adjacencies you depend on; partner with the teams that own them; share the timeline.
Conclusion
Energy benchmarking for buildings is a data pipeline that ingests, normalizes, and computes benchmarks consistently, producing the auditable, repeatable output ESG reporting requires. The discipline that delivers it is the same discipline behind any reporting pipeline: automate ingestion, normalize for comparison, and make output auditable.
Key Takeaways:
- Benchmarking is normalization and repeatability, not just collection
- Normalize for area, weather, and use to compare buildings fairly
- Produce auditable, repeatable output ESG reporting can rely on
Building a benchmarking pipeline well requires ingestion, normalization, and auditability discipline. When done correctly, it produces:
- Benchmarking that runs repeatably instead of being re-done
- Fair, normalized comparison across the portfolio
- Auditable, consistent output ESG reporting can rely on
- Reliable figures through data quality and governance
Reliability Alone Doesn't Build Stakeholder Trust
Inside a published-SLA program that turned silent reliability gains into a +42 NPS swing.
What Logiciel Does Here
If your energy benchmarking is a quarterly manual scramble, build a pipeline that ingests meter and utility data, normalizes for fair comparison, and produces auditable, repeatable ESG output.
Learn More Here:
- Carbon Accounting Pipelines: Scope 1, 2, and 3 at Scale
- Smart Building Data Architecture: From Sensors to Operational Insight
- Data Quality and Anomaly Detection
At Logiciel Solutions, we work with sustainability and data leaders on energy benchmarking pipelines, normalization, and ESG-ready reporting. Our reference patterns come from production building data platforms.
Explore how to build energy benchmarking data pipelines for ESG.
Frequently Asked Questions
What is an energy benchmarking pipeline?
An automated data pipeline that ingests building meter and utility data from varied sources, normalizes it for fair comparison by area, weather, and use, computes benchmarks consistently, and produces auditable, repeatable output for ESG reporting, rather than assembling benchmarks manually each cycle.
Why isn't collecting consumption numbers enough?
Because raw consumption is not comparable across buildings of different sizes, climates, and uses, and a manual collection cannot reliably provide the consistent, auditable, repeatable data ESG reporting requires. The work is normalization and producing reliable, traceable output.
Why does normalization matter in benchmarking?
Because buildings differ in floor area, climate, and use, so raw energy consumption is not a fair basis for comparison. Normalizing for these factors makes benchmarks comparable across a portfolio, which is essential for meaningful ESG reporting.
Why does ESG reporting need auditable output?
Because reported energy figures are scrutinized and must be traceable to source data and reproducible. A manual scramble that cannot reproduce its numbers fails that bar, whereas a pipeline produces consistent, auditable output with an audit trail.
What is the biggest mistake in energy benchmarking?
Treating it as a quarterly manual collection rather than a pipeline. This produces inconsistent, hard-to-audit figures and compares raw consumption without normalization. Build a pipeline that ingests, normalizes, computes consistently, and produces auditable, repeatable output.