The Three Hundred Percent Bill Growth
A B2B SaaS company tracked AI infrastructure costs from January 2024 to January 2026. Revenue grew 110 percent. AI cloud spend grew 312 percent. The unit economics had drifted from sustainable to alarming, and the CFO wanted a written plan for getting them back to defensible math within two quarters.
A16Z's enterprise AI infrastructure research tracks AI cloud spend growing 3x faster than other cloud categories (Andreessen Horowitz, "The State of AI Infrastructure 2024"). The growth is partly justified by genuine value creation and partly preventable through known optimization levers.
The honest answer for that CFO and most CFOs in 2026: twelve specific levers, pulled in priority order, typically cut AI cloud bills 40-70 percent within two quarters without changing what the AI features do. The work is mechanical once the prioritization is correct.
Coined Frame: The Twelve Levers in Priority Order
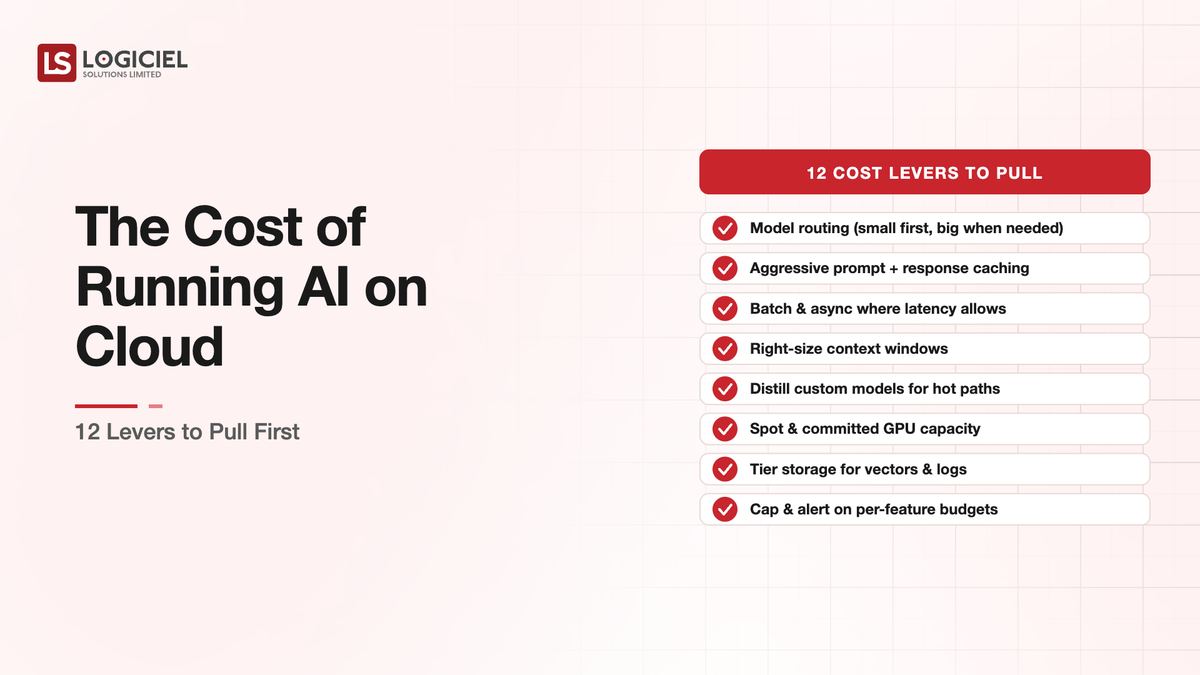
Twelve levers move the AI cloud bill. Each one has a specific saving range and a specific effort range. Pulled in the priority order below, they unlock each other and produce visible savings quickly.
Lever 1 - Prompt caching. System prompts and document context cached across requests. Anthropic's caching can cut affected costs up to 90 percent (Anthropic, "Prompt caching with Claude," 2024). Effort: low. Savings: typically 20-50 percent of inference cost.
Lever 2 - Response caching. Identical user inputs return cached responses. Mechanical to implement. Savings depend on traffic pattern, typically 10-30 percent of inference cost.
Lever 3 - Tier routing. Small fast models handle simple requests, frontier models handle complex requests. Routing logic added. Effort: medium. Savings: typically 35-55 percent of model spend.
Lever 4 - Batch processing. Non-interactive workloads moved to batch endpoints at roughly 50 percent pricing. Effort: medium (requires identifying batch-eligible traffic and infrastructure). Savings: typically 20-40 percent on batched workloads.
Lever 5 - Contract negotiation. Reserved capacity, committed spend agreements, volume discounts for spend above $50K monthly. Effort: low (mostly procurement work). Savings: typically 15-30 percent of model provider spend.
Lever 6 - Prompt compression. Reducing prompt size while preserving quality. Few-shot example pruning, structured output schemas, prompt rewriting. Effort: medium. Savings: typically 20-40 percent of prompt token costs.
Lever 7 - Embedding lifecycle management. Hot, warm, cold tiers for vector storage. Lifecycle policies for embedding retirement. Effort: medium. Savings: typically 30-50 percent of vector storage cost.
Lever 8 - GPU right-sizing. For self-hosted models, matching GPU class to workload (L4 vs L40S vs A100 vs H100). Effort: medium-high. Savings: typically 20-40 percent of GPU spend.
Lever 9 - Spot capacity for batch and training. Batch inference, training, and dev workloads moved to spot instances. Effort: high (requires spot-tolerant architecture). Savings: typically 60-80 percent on affected workloads.
Lever 10 - Egress consolidation. Co-locating compute with data, reducing cross-region transfer, CDN for high-volume user traffic. Effort: medium. Savings: typically 30-60 percent of egress costs.
Lever 11 - Multi-provider routing. Workloads routed to the most cost-effective provider for each request, with quality-equivalent fallback. Effort: high. Savings: typically 15-25 percent on routed workloads.
Lever 12 - Architectural redesign. Workload-specific redesign to reduce inference calls (better retrieval reducing the need for model reasoning, structured generation reducing token usage). Effort: high. Savings: highly variable, sometimes very large.
Pulled in this order, the first six levers typically capture 60-75 percent of available savings with relatively low effort. Levers 7-12 capture the remaining savings with higher effort.
Why Order Matters
The order is not arbitrary. Three principles drive it.
Effort-to-savings ratio. Levers 1 and 2 produce meaningful savings with hours of engineering work. They should be done first because the ROI is unambiguous and the engineering capacity required is minimal.
Dependency unlocking. Lever 3 (tier routing) requires good observability, which is often built as part of Lever 1 work. Lever 4 (batching) requires the same infrastructure that Lever 3 uses. The work compounds.
Political momentum. Programs that produce visible savings in 30 days have organizational support to continue. Programs that promise savings in six months often lose support before delivery. The early levers fund the later ones politically.
A team that starts with Lever 12 (the most impactful but also the most expensive) typically does not finish the program. A team that starts with Lever 1 typically pulls all twelve over six to nine months.
What Each Lever Looks Like in Practice
Lever 1 in practice: identify system prompts and document context that repeats across requests, enable caching at the provider level, monitor cache hit rates, optimize prompts to maximize cache reuse. Days of work for an experienced engineer.
Lever 3 in practice: classifier identifies request complexity, simple requests go to GPT-4o-mini, Claude Haiku, or equivalent small models; complex requests go to frontier models. Eval framework runs to ensure quality is maintained. Weeks of work for an engineering team.
Lever 7 in practice: vector store policies that move embeddings older than X days to compressed indexes, embeddings older than Y days to archive, with automatic re-embedding capability if archived embeddings are needed. Weeks of engineering work plus policy design.
Lever 11 in practice: abstraction layer between application and model providers, routing logic that selects provider based on request type and cost, eval validation that quality is consistent across providers. Months of engineering work but unlocks structural cost flexibility.
The pattern across levers: lower-numbered levers are usually engineering work that produces fast results. Higher-numbered levers are usually architectural work that produces durable results.
What This Costs
For a mid-market AI workload at $200K-$500K monthly inference spend, the twelve-lever program typically requires two engineers for two quarters of focused work, plus tooling investments of $30K-$150K annually.
Total program cost is typically 8-15 percent of annual AI spend. Total savings are typically 40-70 percent of annual AI spend. The math justifies the work at almost any scale where AI is becoming a meaningful cost line.
What Logiciel Does Here
Logiciel works with engineering teams whose AI cloud spend has grown faster than their unit economics can sustain. The work is structured around the twelve-lever priority list, adjusted for the specific workload profile.
The AI FinOps Framework covers the five-lever subset that produces most of the savings. The AI Cost Per Request framework covers unit economics analysis for AI features.
A 30-minute working session is enough to identify which levers are most relevant to your current bill and the priority order for your specific situation.
FAQs
Which lever should I pull first?
Almost always Lever 1 (prompt caching) if you have any repeated context in your prompts. The effort is hours, the savings show up in the next billing cycle, and the work informs all subsequent optimization.
How do I know if my AI bill has waste in it?
Two heuristics. Cost per active user above $3 for SaaS or $0.50 for consumer is usually a sign of optimization opportunity. Cost growth rate above revenue growth rate is usually a sign of unit economics drift.
Can I do this work without specialized expertise?
Levers 1-5 are accessible to most senior engineering teams. Levers 6-12 typically benefit from AI engineering or FinOps expertise specifically. The work scales from generalist-friendly to specialist-required as you move down the list.
How quickly will I see savings?
Lever 1 within one billing cycle if implemented correctly. Levers 2-5 within one quarter. Levers 6-12 within six months. The savings ramp predictably if the levers are pulled in order.
How do I maintain savings over time?
Continuous monitoring with cost dashboards, anomaly alerts, and regular FinOps review. The savings disappear without sustained discipline. The teams that maintain results have integrated cost monitoring into their engineering operations.
Sources: