The Stack That AWS Provides and the Gaps That Remain
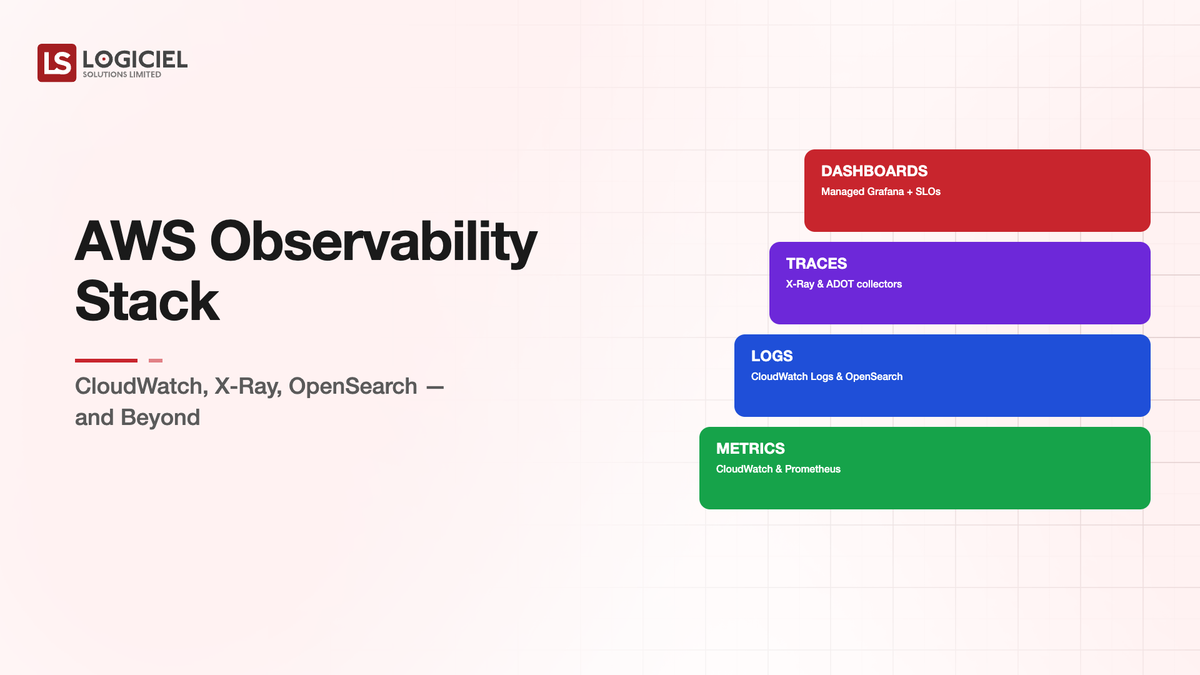
AWS provides observability tooling that covers a significant portion of what production systems need. CloudWatch, X-Ray, OpenSearch, Managed Grafana, Managed Prometheus, and the supporting services together form a credible observability stack. The stack is not complete. Three gaps remain where the AWS-native tooling either does not exist or does not match alternatives.
Teams that build observability assuming the AWS-native stack covers everything discover the gaps when specific operational needs surface. Teams that understand the gaps from initial design make explicit decisions about whether to fill them with third-party tooling, custom infrastructure, or by accepting the gaps.
Datadog, New Relic, Dynatrace, and other third-party observability platforms compete with AWS-native offerings in part by filling the gaps that AWS leaves. The competition is healthy and the decision is workload-specific.
Reactive to Proactive Incident Elimination
Inside a 6-month transition that took emergency incidents from monthly to zero.
What the AWS-Native Stack Covers
The AWS-native observability stack covers metrics, logs, and distributed tracing for AWS workloads with comprehensive depth.
CloudWatch covers metrics and logs for AWS services. Every AWS service emits metrics to CloudWatch automatically. Logs from EC2, Lambda, ECS, EKS, RDS, and most other services flow into CloudWatch with minimal configuration. Dashboards, alerts, and metric math operate on this data.
X-Ray covers distributed tracing. Requests flowing through Lambda, API Gateway, ECS, and EKS get traced when X-Ray SDK is integrated. The traces show service boundaries, latency at each step, and error propagation paths.
OpenSearch (with the managed service or Serverless variant) covers log analytics and full-text search across logs. Workloads that need to query logs flexibly typically run them through OpenSearch.
Managed Grafana provides visualization on top of CloudWatch, OpenSearch, and Prometheus data sources. Managed Prometheus provides Prometheus-compatible metrics for Kubernetes workloads and similar.
Together, the stack covers most observability needs for AWS-native workloads. Workloads built on AWS services with appropriate integration get production observability without significant additional investment.
Gap One: Cross-Account and Cross-Cloud Aggregation
The first gap is aggregating observability data across multiple AWS accounts or across AWS and non-AWS environments.
The AWS-native stack works within a single account. CloudWatch cross-account observability has improved in 2024-2025 with cross-account dashboards and metric sharing, but the configuration is non-trivial and the experience is less unified than third-party platforms provide. For organizations operating dozens of AWS accounts (common at enterprise scale), the cross-account experience matters.
Cross-cloud aggregation is more limited. CloudWatch does not aggregate data from Azure, GCP, or on-premises environments. For organizations operating multi-cloud or hybrid infrastructure, the AWS-native stack covers only the AWS portion of the estate.
Third-party platforms (Datadog, New Relic, Dynatrace, Splunk Observability, Grafana Cloud) provide cross-account and cross-cloud aggregation as a core feature. The aggregation is the value they provide at scale.
For single-account, AWS-only workloads, the gap is small. For multi-account or multi-cloud workloads, the gap is meaningful enough to justify third-party platform investment.
Gap Two: Application-Level Observability for Custom Workloads
The second gap is observability for application-specific behavior that AWS services do not natively understand.
CloudWatch and X-Ray instrument what AWS services do. Application-level concepts (business transactions, user sessions, feature usage, custom workflows) are not in the AWS-native model unless the application explicitly instruments them.
Application performance monitoring (APM) platforms (Datadog APM, New Relic, Dynatrace) provide application-level instrumentation through agents and SDKs that capture this data more comprehensively than X-Ray. The depth of application-level observability is the gap.
For some workloads, the gap is small because the business transactions are visible at the AWS service level. For other workloads, the gap is large because the business behavior lives inside the application code rather than at service boundaries.
The decision is workload-specific. Workloads with complex application-level logic benefit from APM. Workloads where AWS service-level observability is sufficient do not need it.
Gap Three: Specialized Observability Categories
The third gap is specialized observability categories that AWS-native tools do not cover at the depth specialized vendors provide.
Real user monitoring (RUM) for web applications. CloudWatch RUM exists but is less mature than alternatives (Datadog RUM, New Relic Browser, Sentry).
LLM-specific observability. CloudWatch can log Bedrock invocations and produce basic metrics. Dedicated LLM observability platforms (Helicone, Langfuse, Arize, Galileo) provide deeper analysis of prompts, completions, evaluation results, and cost attribution.
Security observability (SIEM and SOAR). AWS Security Hub and GuardDuty provide AWS-specific security observability. Enterprise SIEM requirements typically need Splunk, Sumo Logic, or similar platforms.
Synthetic monitoring. CloudWatch Synthetics exists. Specialized synthetic monitoring tools (Pingdom, Catchpoint, Datadog Synthetics) often provide more sophisticated capabilities.
For workloads where any of these specialized categories are operationally important, the AWS-native tooling may be insufficient. The decision is category-by-category.
The Hybrid Stack That Most Enterprises Run
Enterprises running serious production workloads on AWS in 2026 typically operate hybrid observability stacks.
CloudWatch handles AWS service-level metrics, logs, and basic dashboards. The data is captured at no marginal cost because AWS services emit it automatically.
A third-party platform (typically Datadog, New Relic, or Dynatrace) provides cross-account aggregation, application-level depth, and specialized observability categories. The platform forwards CloudWatch data and adds its own instrumentation.
Specialized tools fill specific gaps where the third-party platform is also weak. LLM observability platforms for AI workloads. Security platforms for compliance-driven observability.
The hybrid stack costs more than pure AWS-native and provides capabilities that pure AWS-native cannot match. The decision is whether the additional cost is worth the additional capability for the specific workload.
What This Costs
The AWS-native stack adds variable cost. CloudWatch ingestion and storage scale with volume; logs and metrics for moderate workloads typically cost $1K-$15K per month. X-Ray and OpenSearch add to this.
Third-party platforms typically cost $50K-$500K annually for moderate to large deployments depending on data volume and feature scope. The pricing scales with hosts, custom metrics, and log volume.
The total observability cost for a serious AWS workload typically runs 1-3 percent of the underlying infrastructure cost. Lower percentages usually indicate under-observation. Higher percentages usually indicate redundancy or over-instrumentation.
Data Infrastructure ROI Calculator
Use this ROI calculator to measure maintenance cost, inefficiencies, and hidden losses in your data stack.
Call to Action
What Logiciel Does Here
Logiciel works with engineering teams designing or rationalizing observability stacks on AWS. The work is typically structured around assessing what the workload actually needs against what the AWS-native stack provides, with explicit decisions about which gaps to fill and how.
The Continuous Intelligence Reliability framework covers the broader reliability observability for AI-integrated systems. The Data Observability framework covers the data-specific observability that overlaps with the general observability stack.
A 30-minute working session is enough to assess your current observability against the three gaps.
Frequently Asked Questions
Should I use CloudWatch only or add a third-party platform?
Workload-dependent. For single-account, AWS-only workloads with moderate complexity, CloudWatch alone is often sufficient. For multi-account, cross-cloud, or application-complex workloads, third-party platforms typically pay back the cost.
How do I avoid paying twice for the same data?
Through careful data routing. Some platforms (Datadog, New Relic) ingest CloudWatch data with their own data ingestion fees. Mature observability practice routes specific data to specific destinations rather than duplicating broadly. The cost optimization work on observability is non-trivial at scale.
What is the right team for observability operations?
An observability engineer or platform engineer at scale. Below a certain scale, the SRE or platform engineering team includes observability as part of their broader responsibilities. The investment in specialization matches the operational complexity.
How does AI workload observability fit into the AWS stack?
CloudWatch covers Bedrock metrics and logs. X-Ray traces some Bedrock invocations. Specialized LLM observability (Helicone, Langfuse) covers prompt-level analysis. The combination handles AI workloads better than CloudWatch alone.
When should I migrate from a third-party platform back to AWS-native?
When the third-party platform's cost has grown beyond what its differentiation justifies for your specific workload mix. Rare but real. The decision is usually driven by cost growth and changes in workload mix rather than by AWS-native tooling reaching parity. Sources: - AWS Observability Documentation, 2024 - Gartner, "Observability Magic Quadrant 2024"