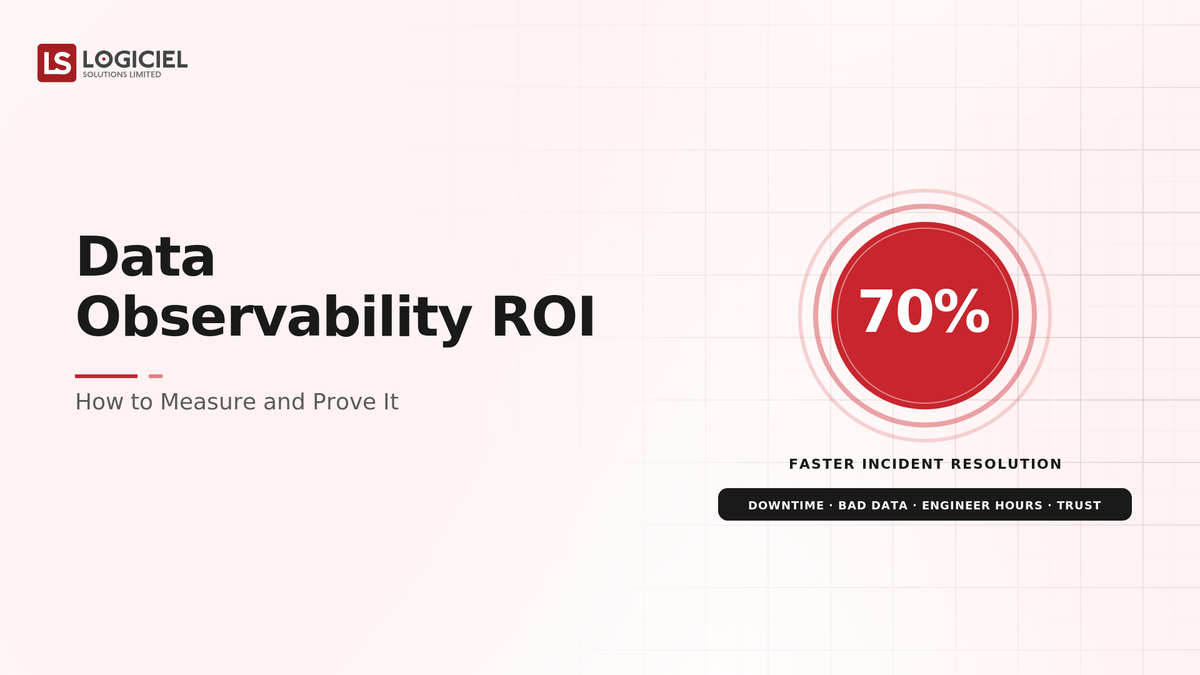
Data observability gets funded when you can put a number on what bad data already costs you, and stalls when you cannot. That is the whole ROI problem. The value of observability, catching data issues before they reach a dashboard, a model, or a customer, is real, but stated as "better data quality" it loses to initiatives with dollar signs. Measuring data observability ROI means quantifying the cost of the bad-data incidents you have now, the detection time you would save, and the decisions you would protect, then weighing that against the tooling and effort.
Data observability is the capability to detect data problems, stale, incomplete, malformed, wrong, before consumers do. Its return is avoided cost: bad decisions not made on wrong data, models not trained on garbage, engineering time not lost to chasing silent failures, trust not eroded. The job is to make that avoided cost explicit, because "we caught a data problem early" only competes for budget when it has a price attached.
If you lead data, here is how to build the case: where observability value comes from, how to quantify the cost of bad data, how to measure the improvement, and how to prove it over time.
Healthcare CIO Cuts AI Costs Without Accuracy Loss
A field guide to AI cost optimization for VP Engineering teams running clinical and operational LLMs in production.
Where Data Observability Value Comes From
The value comes from what bad data costs when it goes undetected, and observability reduces. Wrong data drives wrong decisions, a misreported metric, a bad forecast, a flawed model. Silent failures burn engineering time in detective work after the fact. Bad data erodes trust in the whole data platform, so people stop using it. And in regulated or customer-facing contexts, bad data can mean compliance or reputation cost. Observability reduces all of this by catching problems early, when they are cheap to fix, instead of late, when they have already done damage. The ROI is that reduced cost made explicit.
How to Measure the ROI
1. Quantify the cost of bad data today
Count your recent bad-data incidents and estimate what each cost: time to detect and fix, decisions affected, rework, eroded trust. Most teams have never added this up, and the number is usually larger than expected. This is what observability reduces.
2. Measure detection-time improvement
Observability's most direct effect is catching issues earlier. Measure the reduction in time-to-detection, from "a customer told us" to "an alert caught it before release." Earlier detection means cheaper fixes and fewer affected decisions.
3. Translate into avoided cost
Convert the improvement into value: bad decisions avoided, engineering time saved on detective work, rework avoided, trust preserved. This turns "better data quality" into a number.
4. Weigh against the investment
Compare the avoided cost against the cost of observability tooling and the effort to instrument and maintain it, producing an ROI.
5. Prove it over time
Track incidents caught early, detection time, and avoided cost, so the ROI is demonstrated continuously, not just projected at purchase.
Common Misconception
The misconception that keeps observability unfunded: the value of data observability is obvious, so it does not need a number.
Its value is real but not self-evident to a budget owner, and "better data quality" loses to quantified initiatives every time. The cost of bad data is usually invisible because nobody has added up the incidents, so the value of catching them looks like nothing. Quantifying the cost of bad data, and the detection observability speeds up, is what turns an obvious-but-vague benefit into a fundable number.
Key Takeaway: Data observability ROI is the quantified cost of bad data, reduced by earlier detection, translated into avoided cost. "Better data quality" is not a number, and numbers are what get funded.
Where Observability ROI Measurement Goes Right
- The cost of current bad-data incidents quantified
- Detection-time improvement measured and translated to avoided cost
- A business case weighed against tooling cost, proven over time
Where It Goes Wrong
- Pitching "better data quality" with no number
- Never adding up what bad data already costs
- Improvement not translated into avoided cost
Key Takeaway: The observability investment that gets funded quantifies the cost of bad data and the detection it speeds up; the one that stalls calls the value obvious and leaves it unpriced.
What High-Performing Teams Do Differently
1. Add up the cost of bad data
They quantify recent bad-data incidents, the cost most teams never total.
2. Measure detection time
They track how much earlier observability catches issues.
3. Translate to avoided cost
They convert earlier detection into decisions protected and time saved.
4. Weigh against tooling cost
They compare avoided cost against the observability investment.
5. Prove it continuously
They track incidents caught and cost avoided over time.
Logiciel's value add is helping data teams measure and prove observability ROI, quantifying the cost of bad data, measuring detection improvement, translating it to avoided cost, and proving it, so observability is funded on a number rather than an assertion.
Takeaway for High-Performing Teams: Measure observability ROI as the quantified cost of bad data reduced by earlier detection. Total your bad-data incidents, measure detection-time improvement, translate to avoided cost, and prove it continuously, so the investment competes on evidence.
Adjacent Capabilities and Connected Work
This work does not exist in isolation. Data observability depends on, and feeds into, several adjacent capabilities. Building one without thinking about the others is the most common scoping mistake.
In most organizations, observability shares infrastructure with the data pipelines, the catalog and lineage tooling, and the alerting process. It shares team capacity with data engineering, analytics, and platform engineering. And it shares leadership attention with whatever the next data-quality initiative is on the roadmap. Naming these adjacencies upfront helps the program scope realistically and helps leadership see the work as a portfolio rather than a one-off project.
The most common mistake in adjacent-capability scoping is treating each adjacency as someone else's problem. The bad-data cost accounting is your problem to build. The detection measurement is your problem. The translation to avoided cost is your problem. Pretending otherwise pushes work to teams that did not plan for it, and the work returns to you later as an unfunded program and a silent data failure in production. Own the adjacencies you depend on, partner with the teams that own them, and share the timeline.
Conclusion
Data observability ROI is the quantified cost of bad data, reduced by catching problems earlier, translated into avoided cost and proven over time, that justifies the investment with a number instead of "better data quality." The cost of bad data is usually invisible only because nobody added it up. Once you do, and measure how much earlier observability catches issues, the case makes itself.
Key Takeaways:
- Observability ROI is the cost of bad data reduced by earlier detection
- The cost is invisible only because the incidents are never totaled
- Quantify the cost, measure detection improvement, translate, and prove it
Done right, observability ROI measurement funds the investment on a defensible avoided-cost number, instead of letting an obvious-but-vague benefit lose every budget cycle.
Real Estate Platform Ships Agentic AI in 10 Weeks
A time-to-value playbook for VPs of Product who need agents in production this quarter, not next year.
What Logiciel Does Here
If your data observability case keeps losing to "better data quality," quantify the cost of bad data, measure the detection you would speed up, and translate it into avoided cost.
Learn More Here:
- A Practical Roadmap to Data Observability
- The Data SLA Playbook
- Streaming Data Quality
At Logiciel Solutions, we work with data leaders on data observability ROI, bad-data cost accounting, detection measurement, and avoided-cost translation. Our reference patterns come from production data platforms.
Explore how to measure and prove data observability ROI.
Frequently Asked Questions
What does data observability ROI consist of?
The quantified cost of bad data, wrong decisions, engineering time lost to detective work, rework, eroded trust, compliance or reputation cost, reduced by catching issues earlier, translated into avoided cost and weighed against the cost of observability tooling and the effort to instrument and maintain it. The benefit is the avoided cost, made explicit.
Why isn't the value of observability self-evident to budget owners?
Because the cost of bad data is usually invisible, nobody has added up the incidents, so the value of catching them looks like nothing, and "better data quality" loses to initiatives with dollar figures. Quantifying the cost of bad data and the detection observability speeds up turns a vague benefit into a fundable number.
What is the most direct effect to measure?
Detection-time improvement: how much earlier observability catches data issues, ideally moving from "a customer told us" to "an alert caught it before release." Earlier detection means cheaper fixes and fewer affected decisions, and it is the most direct, measurable effect of the investment.
How do you translate detection into a dollar value?
Convert the earlier detection into bad decisions avoided, engineering time saved on after-the-fact detective work, rework avoided, and trust preserved. Each of those has an estimable cost, and reducing it is the value. That translation is what turns "we caught it early" into a number a budget owner can weigh.
What is the biggest mistake in justifying observability?
Treating the value as obvious and pitching "better data quality" without a number. That loses to quantified initiatives every time. The cost of bad data is real but uncounted, so quantifying recent incidents and the detection improvement is what makes the case fundable rather than self-evidently ignored.