The $2M Surprise
A B2B SaaS company opened their Q3 2025 data infrastructure bill expecting $400K monthly. The bill landed at $670K. By year-end, projected annual spend on data pipelines had grown from $4.8M to $8.1M. The CFO asked the obvious question. The data team did not have a clean answer because nobody had broken the spend down by where the money was actually going.
This is the modal data pipeline cost crisis in 2026. The bill grew because every team added pipelines, every pipeline triggered downstream pipelines, and nobody owned the aggregate spend. Snowflake's own published analysis of customer usage patterns found 30 percent of warehouse compute spend goes to duplicated work across teams (Snowflake, "Cost Optimization Patterns for Enterprise Data Platforms," 2024).
If your data pipeline bill is growing faster than your data volume, the spend has hidden patterns. Three zones tell you where to look.
Coined Frame: The Three Cost Zones
Data pipeline cost lives in three zones. Most teams optimize one and discover the others when the bill keeps growing.
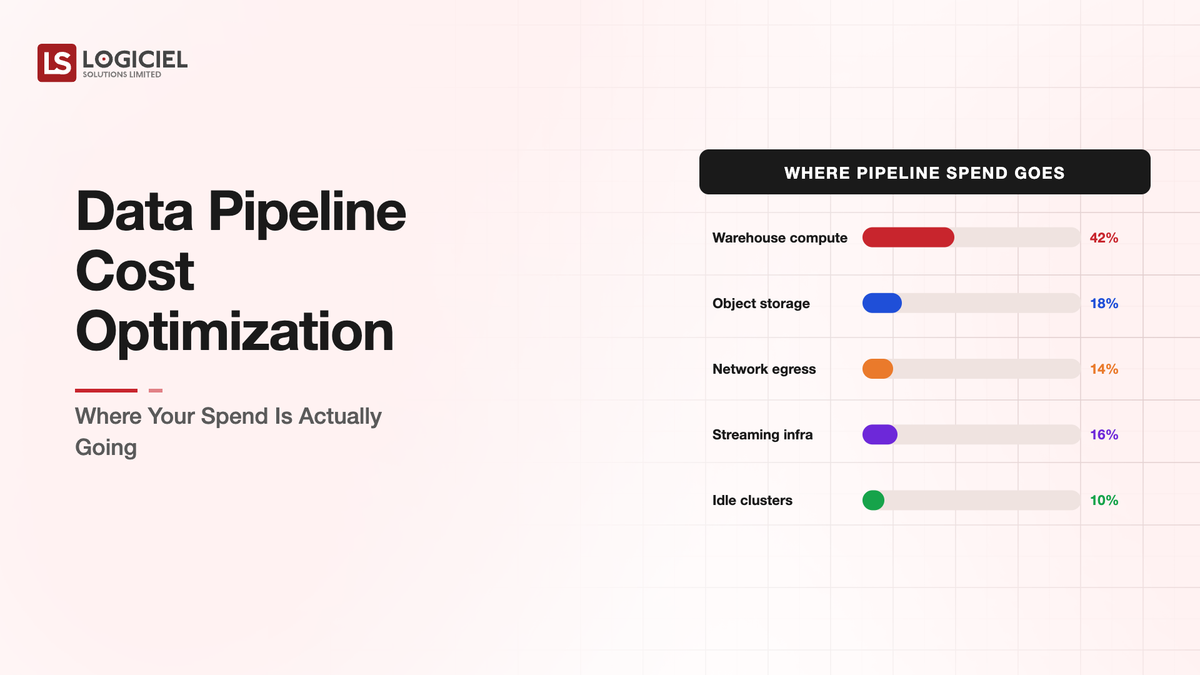
Zone 1 - Storage. Where data sits. Data warehouse storage, data lake storage, vector database storage, cache storage. Storage is typically 20-30 percent of total data spend and rarely the place where optimization produces the largest gains. Compression, retention policies, and cold-tier movement matter but rarely move the bill by half.
Zone 2 - Compute. Where data is transformed and queried. ETL/ELT jobs, query compute, analytics workloads, embedding generation, AI inference on data. Compute is typically 50-65 percent of total data spend and is where most optimization opportunities live.
Zone 3 - Movement. Where data moves between systems. Egress charges, cross-region replication, integration tool fees, streaming infrastructure. Movement is typically 10-25 percent of total spend and is the most overlooked zone because the charges hide in multiple line items.
A team that optimizes Zone 1 aggressively while ignoring Zones 2 and 3 saves 5-8 percent. A team that addresses Zone 2 first typically saves 25-40 percent. The order matters.
Where Compute Spend Actually Goes
Inside Zone 2, four patterns account for most of the spend.
Duplicated transformations. The same business logic runs multiple times across teams because no team trusts the others' output. Marketing has its own customer table. Finance has its own. Sales has its own. Each one computes from raw events independently. Snowflake's research cited above quantified this as 30 percent of warehouse spend on average.
Inefficient query patterns. Queries that scan more data than necessary, joins that produce intermediate result sets larger than they need to be, repeated calculations that should be cached. Modern data warehouses charge per byte scanned. A query that scans 10x what it needs costs 10x what it should.
Always-on infrastructure. Streaming pipelines, real-time materialization, and continuously-running compute that sits idle most of the day. The infrastructure is sized for peak load and paid for at peak load even when running at trough.
Embedding and AI workloads on raw data. New in 2024-2025: embedding generation, semantic enrichment, and AI processing applied to entire datasets when only a fraction is queried. This is becoming the fastest-growing cost line on the compute side.
The teams that move the compute bill meaningfully address these four patterns in sequence. Most teams have done at least some query optimization and stopped there.
The Movement Zone Trap
Movement cost is the most overlooked zone because it shows up across many line items.
Cloud egress. Cross-region replication. Data warehouse integration partner fees (Fivetran, Airbyte, Stitch, Hightouch). API costs for SaaS data sources. CDC tools. Reverse ETL. Each line item alone is moderate. The aggregate is often 15-25 percent of total data spend.
The teams that get this zone under control do three things. They consolidate movement tooling rather than running parallel tools for similar jobs. They monitor egress as a first-class cost line, not as a rounding error. They co-locate compute and storage in the same region for the highest-volume workloads, which eliminates cross-region movement entirely.
The Optimization Order That Works
Three steps in sequence produce most of the available savings for most teams.
Step 1 - Compute audit and consolidation. Identify duplicated transformations and consolidate them into shared models. dbt, Coalesce, and SQLMesh exist for this purpose. The work is political (teams have to agree on shared definitions) more than technical. Savings range from 15 to 30 percent of compute spend.
Step 2 - Query optimization on top workloads. Profile the top 20 queries by cost. Optimize them. Most data warehouses make this profile available through their cost management dashboard. The top 20 queries typically account for 60-80 percent of compute spend. Optimizing them produces another 10-20 percent compute savings.
Step 3 - Movement consolidation and right-sizing. Identify movement tools running parallel jobs. Consolidate. Review cross-region replication necessity. Move heavy workloads to single-region where possible. Savings range from 20 to 40 percent of movement spend.
After these three steps, storage optimization (retention policies, compression, cold-tier movement) catches the long-tail savings. Doing it first inverts the priority and saves less.
What Actually Changed in 2025
Three things shifted the cost-optimization math in the past 18 months.
The data warehouse vendors got more aggressive on usage-based pricing transparency. Snowflake's resource monitor and account usage views, BigQuery's information schema views, and Databricks' system tables all provide cost data at granularity sufficient to find optimization targets.
dbt's adoption became widespread enough that consolidation around shared transformation models is now technically straightforward. The political work of consolidating teams is still the harder problem.
Vector database costs entered the calculation. At small scale, vector storage is a rounding error. At million-or-more-document scale, vector storage and embedding compute become a real line item that deserves explicit optimization attention.
What This Costs
Building a real cost optimization program for data pipelines typically requires one to two senior data engineers for one quarter for the initial audit and optimization push, plus ongoing 10-20 percent of one engineer's time for sustained operations.
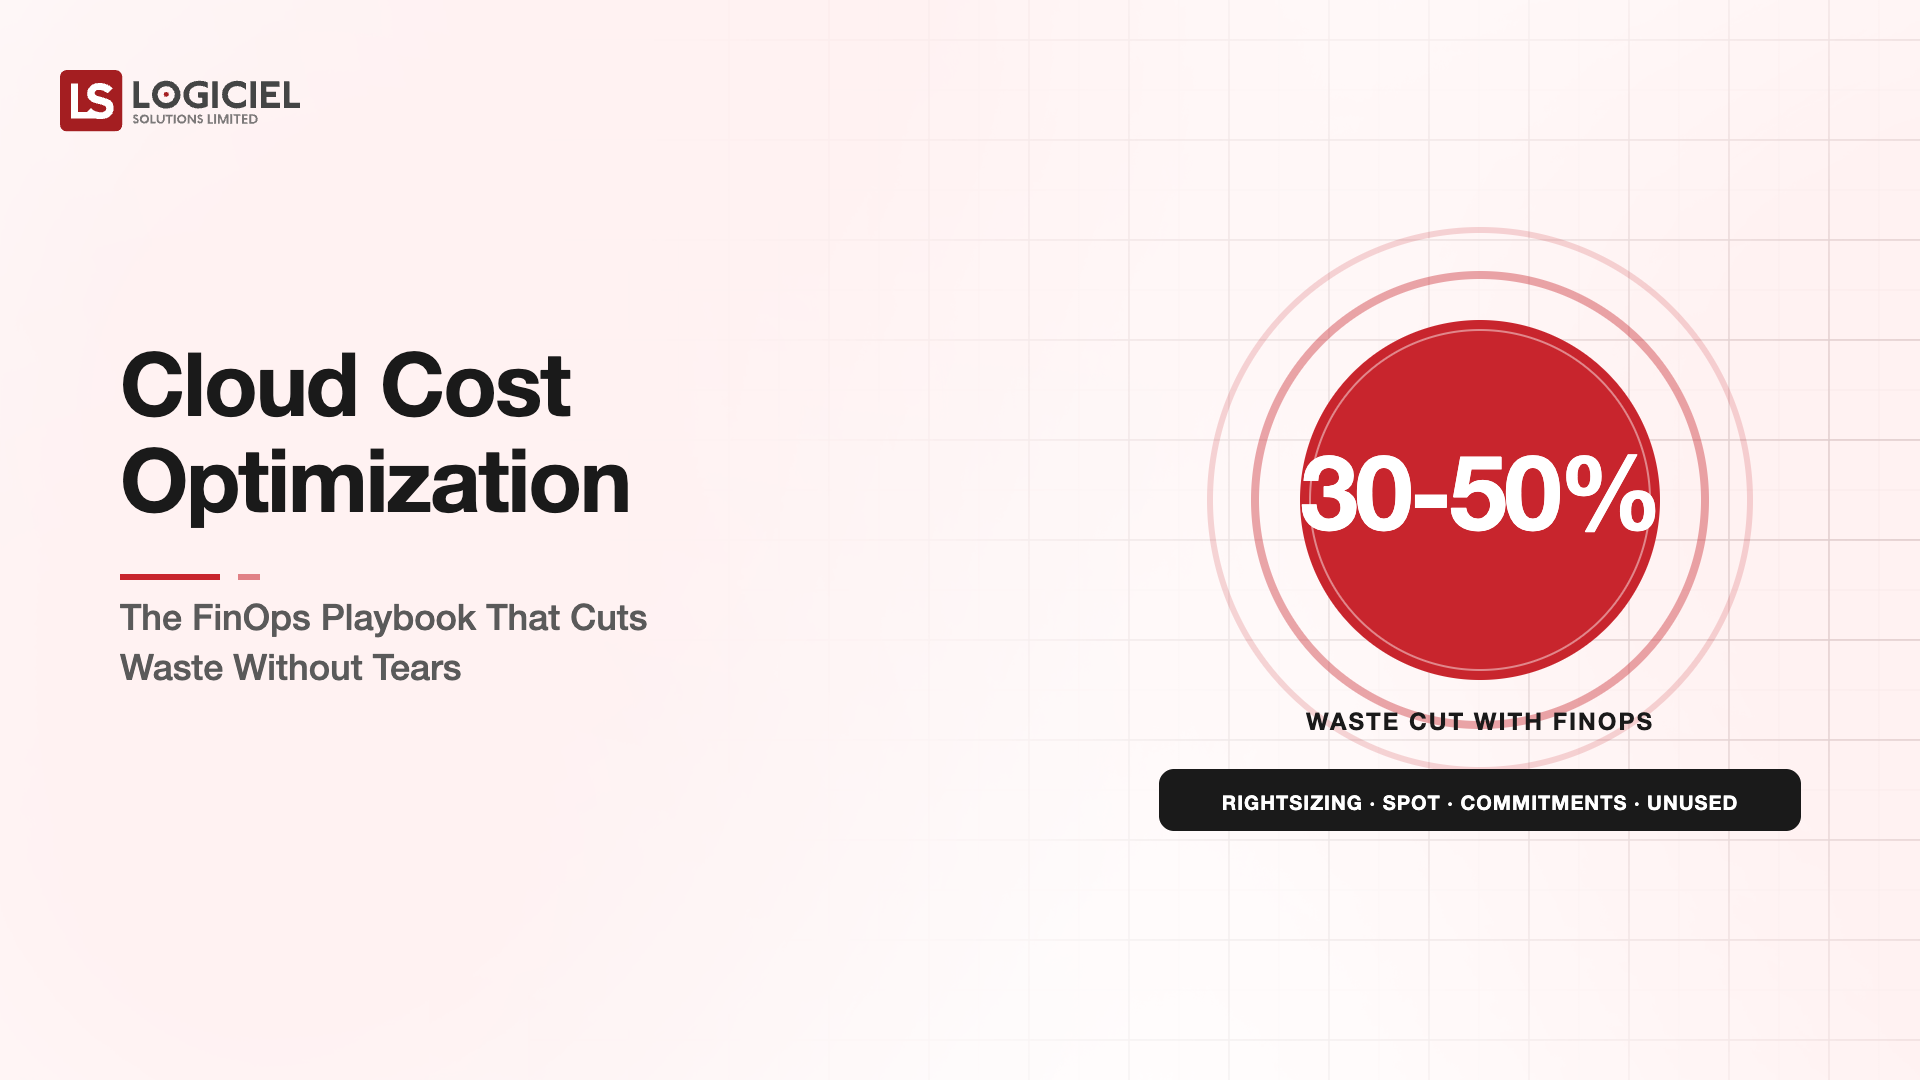
The savings depend on starting state. For teams that have done little optimization to date, 30-50 percent reduction in data spend is achievable in one quarter. For teams that have done basic optimization, 10-20 percent additional savings are typical.
The math justifies the work at almost any scale above $50K per month in data spend.
What Logiciel Does Here
Logiciel works with engineering teams whose data infrastructure costs have grown faster than data volume. The work is structured around the three-zone analysis, with priority on Zone 2 because it produces the largest savings.
The AI FinOps Framework covers the broader cloud cost discipline that data pipeline optimization sits inside. The AI Cost Per Request framework covers unit economics for AI workloads running on the data platform.
A 30-minute working session is enough to map your current spend against the three zones and identify the highest-leverage starting point.
Frequently Asked Questions
How do I find duplicated transformations across teams?
Three signals. Multiple tables in the warehouse with similar names (customer, customers, customer_master). Multiple dbt models producing similar outputs in different domains. Multiple BI dashboards showing slightly different numbers for the same metric. Each is a flag for duplication.
Should I move data workloads to a cheaper warehouse?
Almost never as a first move. Migration costs typically exceed two years of price differential savings. Optimize where you are first. If after optimization the warehouse fit is still wrong, then consider migration with the full cost math.
What is the right cost monitoring cadence?
Daily aggregate review by the data platform team. Weekly cost-per-team breakdown shared with engineering leadership. Monthly cost review with finance. The cadence that catches budget surprises before they become quarterly problems.
How do I handle the political work of consolidating team-owned transformations?
Through shared definitions of business metrics, owned by a cross-functional governance group. Teams keep their domain-specific transformations. The shared core (customer, revenue, product usage) consolidates to canonical models. The political work is in the shared core definitions, not in the domain-specific work.
When does serverless data warehouse pricing make sense vs reserved capacity?
Serverless for variable workloads with peak-to-trough ratios above 3x. Reserved capacity for steady workloads with predictable utilization. Most enterprises have both patterns and benefit from mixed contract structures. Sources: - Snowflake, "Cost Optimization Patterns," 2024 - dbt Labs, "Analytics Engineering Benchmarks 2024"