There is a demand forecast in your utility that drives procurement, dispatch, and market positions, and it is built on historical load patterns alone. It worked when demand was predictable. Now weather swings, electrification, distributed generation, and price-responsive behavior move demand in ways historical load patterns do not capture, and the forecast is confidently wrong exactly when conditions are unusual, which is when an accurate forecast matters most. The forecast that the business bets on is blind to the signals that increasingly drive demand.
This is more than a model needing a refresh. It is utility demand forecasting that must integrate the signals that actually drive demand.
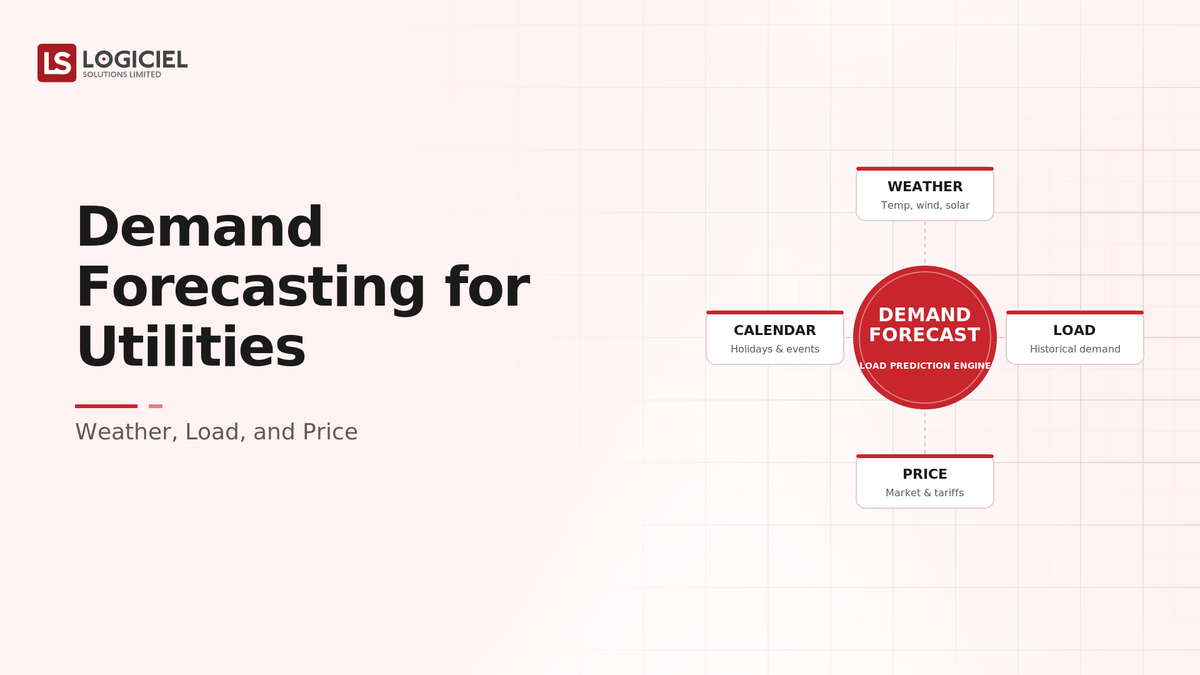
Demand forecasting for utilities is more than extrapolating historical load. It is integrating the signals that drive demand, weather, load history, and price, into a forecast that holds under the unusual conditions where it matters most, with the validation and uncertainty signaling a forecast driving real money requires. The accuracy that matters is on the hard days, not the easy ones.
However, many utilities forecast on historical load alone and discover the forecast fails exactly when weather or price makes conditions unusual, which is when the stakes are highest.
If you are a utility or data leader building demand forecasting, the intent of this article is:
- Define what reliable utility demand forecasting requires
- Walk through integrating weather, load, and price signals
- Lay out the validation and controls a production forecast needs
To do that, let's start with the basics.
How Great CTOs Decide What to Build vs. Buy
Why great CTOs don’t just build they evaluate. Use this framework to spot bottlenecks and benchmark performance.
What Is Utility Demand Forecasting? The Basic Definition
At a high level, utility demand forecasting is predicting electricity demand by integrating the signals that drive it, weather, historical load, and price, into a forecast that holds under unusual conditions, with validation and uncertainty signaling for the decisions it drives.
To compare:
If forecasting on load history alone is steering by the rear-view mirror, integrating weather and price is looking through the windshield. The mirror shows where demand has been; the windshield shows the conditions about to change it.
Why Is Integrated Demand Forecasting Necessary?
Issues that integrated forecasting addresses or resolves:
- Capturing the weather and price signals that drive demand
- Forecasting reliably under unusual conditions
- Supporting procurement, dispatch, and market decisions
Resolved Issues by Integrated Forecasting
- Integrates weather, load, and price signals
- Holds under the unusual conditions where it matters
- Provides validated forecasts with uncertainty for decisions
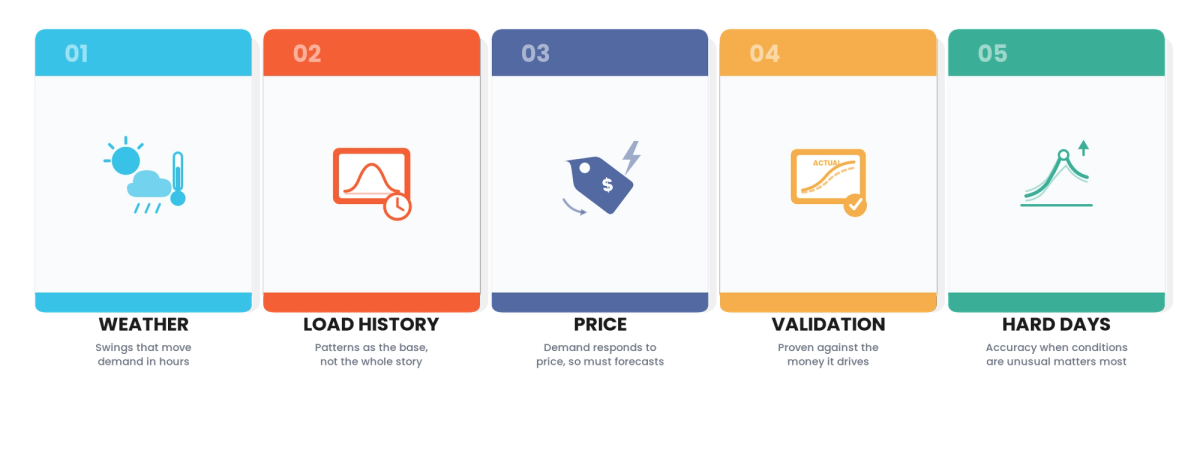
Core Components of Utility Demand Forecasting
- Weather signal integration
- Load history
- Price and demand-response signals
- Validation, especially on hard cases
- Uncertainty signaling
Modern Demand Forecasting Tooling
- Weather data integration and forecasts
- Load and metering data
- Price and market signals
- Forecasting models integrating these signals
- Backtesting and uncertainty quantification
These tools support integrated forecasting; the discipline is integrating the driving signals and validating on the hard days.
Other Core Issues They Will Solve
- Improve procurement and dispatch decisions
- Support market positioning
- Provide uncertainty for risk management
Importance of Integrated Demand Forecasting in 2026
Integrated forecasting matters more as demand drivers grow complex. Four reasons explain why it matters now.
1. Demand drivers have multiplied.
Weather swings, electrification, distributed generation, and price-responsive behavior drive demand in ways historical load alone does not capture.
2. The hard days matter most.
A forecast that is accurate on easy days but wrong on unusual ones fails when stakes are highest. Accuracy on the hard cases is the point.
3. The forecast drives real money.
Procurement, dispatch, and market positions rest on the forecast. Its reliability and uncertainty are financial concerns.
4. Uncertainty must be quantified.
Decisions need to know not just the forecast but its uncertainty, especially under unusual conditions.
Traditional vs. Integrated Forecasting
- Historical load alone vs. weather, load, and price integrated
- Accurate on easy days vs. holding on the hard ones
- Point forecast vs. forecast with uncertainty
- Unvalidated vs. validated on hard cases
In summary: Integrated utility demand forecasting combines the driving signals, holds under unusual conditions, and signals uncertainty, rather than extrapolating historical load.
Details About the Core Components of Utility Demand Forecasting: What Are You Designing?
Let's go through each layer.
1. Weather Layer
The biggest driver.
Weather decisions:
- Weather signals integrated
- Weather forecasts as inputs
- Sensitivity to weather captured
2. Load Layer
The history.
Load decisions:
- Historical load patterns
- Trends like electrification
- Distributed generation effects
3. Price Layer
Demand response.
Price decisions:
- Price and market signals
- Price-responsive demand behavior
- Demand-response effects
4. Validation Layer
Especially the hard cases.
Validation decisions:
- Backtesting across conditions
- Validation on unusual, hard cases
- Accuracy where it matters measured
5. Uncertainty Layer
Knowing the confidence.
Uncertainty decisions:
- Uncertainty quantified
- Confidence under unusual conditions signaled
- Uncertainty informing decisions
Benefits Gained from Integrated Forecasting
- Forecasts that capture the signals driving demand
- Reliability under the unusual conditions where it matters
- Validated forecasts with uncertainty for decisions
How It All Works Together
The forecast integrates the signals that drive demand: weather, including forecasts and demand's sensitivity to it; historical load with trends like electrification and distributed generation; and price and market signals capturing demand-response behavior. The model is validated by backtesting across conditions, with particular attention to the unusual, hard cases where accuracy matters most, not just the easy days. Uncertainty is quantified and signaled, so decisions know the forecast's confidence under unusual conditions. Procurement, dispatch, and market decisions rest on a forecast that captures the driving signals, holds on the hard days, and communicates its uncertainty, rather than one that extrapolates historical load and is blind to what increasingly moves demand.
Common Misconception
Historical load patterns are enough to forecast demand.
Historical load alone misses the weather, electrification, distributed generation, and price-responsive behavior that increasingly drive demand, and it fails exactly under the unusual conditions where an accurate forecast matters most. Reliable forecasting integrates the driving signals and validates on the hard cases.
Key Takeaway: A forecast accurate on easy days and blind to the signals that move demand fails when it matters most. Integrate the drivers and validate on the hard days.
Real-World Integrated Forecasting in Action
Let's take a look at how integrated forecasting operates with a real-world example.
We worked with a utility forecasting on historical load alone, with these constraints:
- Capture the weather and price signals driving demand
- Forecast reliably under unusual conditions
- Provide uncertainty for decisions
Step 1: Integrate Weather
Capture the biggest driver.
- Weather signals and forecasts integrated
- Demand's weather sensitivity captured
- Weather as a primary input
Step 2: Use Load and Trends
Include the history and trends.
- Historical load
- Electrification and other trends
- Distributed generation effects
Step 3: Add Price Signals
Capture demand response.
- Price and market signals
- Price-responsive behavior
- Demand-response effects
Step 4: Validate on Hard Cases
Test where it matters.
- Backtesting across conditions
- Validation on unusual cases
- Hard-day accuracy measured
Step 5: Quantify Uncertainty
Signal confidence.
- Uncertainty quantified
- Confidence under unusual conditions signaled
- Uncertainty informing decisions
Where It Works Well
- Weather, load, and price signals integrated
- Validation on the hard, unusual cases
- Uncertainty quantified for decisions
Where It Does Not Work Well
- Forecasting on historical load alone
- Accuracy only on easy days
- Point forecasts with no uncertainty
Key Takeaway: The demand forecast the business can bet on is the one that integrates the driving signals, holds on the hard days, and signals uncertainty, not the one that extrapolates historical load.
Common Pitfalls
i) Forecasting on load alone
Historical load misses weather, electrification, and price effects, and fails under unusual conditions. Integrate the driving signals.
- Integrate weather
- Add price signals
- Validate on hard cases
ii) Validating only on easy days
Average accuracy hides failure on the hard days that matter. Validate on unusual conditions.
iii) No uncertainty
A point forecast hides its confidence. Quantify and signal uncertainty, especially under unusual conditions.
iv) Ignoring new drivers
Electrification and distributed generation change demand. Capture these, not just historical patterns.
Takeaway from these lessons: Most demand-forecast failures trace to load-only models and easy-day validation, not to forecasting itself. Integrate the drivers, validate on hard cases, and signal uncertainty.
Demand Forecasting Best Practices: What High-Performing Teams Do Differently
1. Integrate the driving signals
Combine weather, load history, and price, the signals that actually move demand, not historical load alone.
2. Capture new demand drivers
Include electrification, distributed generation, and price-responsive behavior, which historical patterns miss.
3. Validate on the hard cases
Backtest across conditions with attention to unusual days, since accuracy there is what matters most.
4. Quantify and signal uncertainty
Provide uncertainty with the forecast, especially under unusual conditions, so decisions account for confidence.
5. Tie validation to the decisions
Validate the forecast against the procurement, dispatch, and market decisions it drives, not just statistical accuracy.
Logiciel's value add is helping utilities integrate weather, load, and price signals, validate on the hard cases, and quantify uncertainty, so demand forecasts hold under the unusual conditions where they matter most.
Takeaway for High-Performing Teams: Focus on integrating the driving signals and validating on the hard days. Utility demand forecasting earns its keep on the unusual conditions, not the easy ones, which is exactly where load-only models fail.
Signals You Are Forecasting Demand Correctly
How do you know the forecast is sound? Not in easy-day accuracy, but in hard-day reliability. Below are the signals that distinguish integrated forecasting from load extrapolation.
The driving signals are integrated. The forecast uses weather, load, and price, not historical load alone.
It holds on the hard days. The team validates and shows accuracy under unusual conditions, not just averages.
New drivers are captured. Electrification, distributed generation, and price response are in the model.
Uncertainty is signaled. The forecast comes with quantified uncertainty, especially under unusual conditions.
Validation ties to decisions. The forecast is validated against the decisions it drives.
Adjacent Capabilities and Connected Work
This work does not exist in isolation. Demand forecasting depends on, and feeds into, several adjacent capabilities. Building one without thinking about the others is the most common scoping mistake.
In most utilities, demand forecasting shares infrastructure with the metering and weather data systems, the data platform, and the procurement, dispatch, and market processes. It shares capacity with data science, grid operations, and the market teams. And it shares leadership attention with whatever the next grid or market initiative is on the roadmap. Naming these adjacencies upfront helps the program scope realistically and helps leadership see the work as a portfolio rather than a one-off project.
The most common mistake in adjacent-capability scoping is treating each adjacency as someone else's problem. The weather and price data the model integrates is your problem. The decisions the forecast drives are your problem to validate against. The uncertainty the risk function needs is your problem. Pretending otherwise pushes work to teams that did not plan for it, and the work returns to you later as a costly forecast miss. Own the adjacencies you depend on; partner with the teams that own them; share the timeline.
Conclusion
Utility demand forecasting must integrate the signals that drive demand, weather, load, and price, and hold under the unusual conditions where it matters most, with validation and uncertainty for the decisions it drives. The discipline that delivers it is the same discipline behind any forecasting at stakes: use the real drivers, validate on the hard cases, and quantify uncertainty.
Key Takeaways:
- Historical load alone misses the signals that increasingly drive demand
- Integrate weather, load, and price, and capture new drivers
- Validate on the hard days and signal uncertainty
Forecasting demand well requires signal, validation, and uncertainty discipline. When done correctly, it produces:
- Forecasts that capture the signals driving demand
- Reliability under the unusual conditions where it matters
- Validated forecasts with uncertainty for decisions
- Better procurement, dispatch, and market decisions
Is Your Engineering Velocity Actually Real?
Measure and multiply engineering velocity using AI-powered diagnostics and sprint-aligned teams.
What Logiciel Does Here
If your demand forecast runs on historical load alone, integrate weather and price signals, validate on the hard cases, and quantify uncertainty before the next unusual conditions arrive.
Learn More Here:
- Renewable Generation Forecasting: Solar, Wind, and the Mix
- AI Optimization for Energy Trading: Latency Meets FinOps
- Predictive Analytics and Forecasting Services
At Logiciel Solutions, we work with utilities on demand forecasting, signal integration, and uncertainty quantification. Our reference patterns come from production utility forecasting systems.
Explore how to build utility demand forecasting on weather, load, and price.
Frequently Asked Questions
What signals should utility demand forecasting integrate?
The signals that actually drive demand: weather, including forecasts and demand's sensitivity to it; historical load with trends like electrification and distributed generation; and price and market signals capturing demand-response behavior. Historical load alone misses much of what now moves demand.
Why isn't historical load enough?
Because weather swings, electrification, distributed generation, and price-responsive behavior increasingly drive demand in ways historical patterns do not capture, and a load-only forecast fails exactly under the unusual conditions where an accurate forecast matters most.
Why validate on the hard cases specifically?
Because a forecast that is accurate on easy, typical days but wrong on unusual ones fails when the stakes are highest. Average accuracy hides hard-day failure, so validation should focus on the unusual conditions where the forecast must hold.
Why does the forecast need uncertainty?
Because procurement, dispatch, and market decisions need to know not just the forecast but its confidence, especially under unusual conditions. Quantified uncertainty lets decision-makers manage risk rather than treating a point forecast as certain.
What is the biggest mistake in utility demand forecasting?
Forecasting on historical load alone and validating on easy days. The model is then blind to the signals that increasingly drive demand and fails under the unusual conditions where it matters most. Integrate weather and price, validate on hard cases, and signal uncertainty.