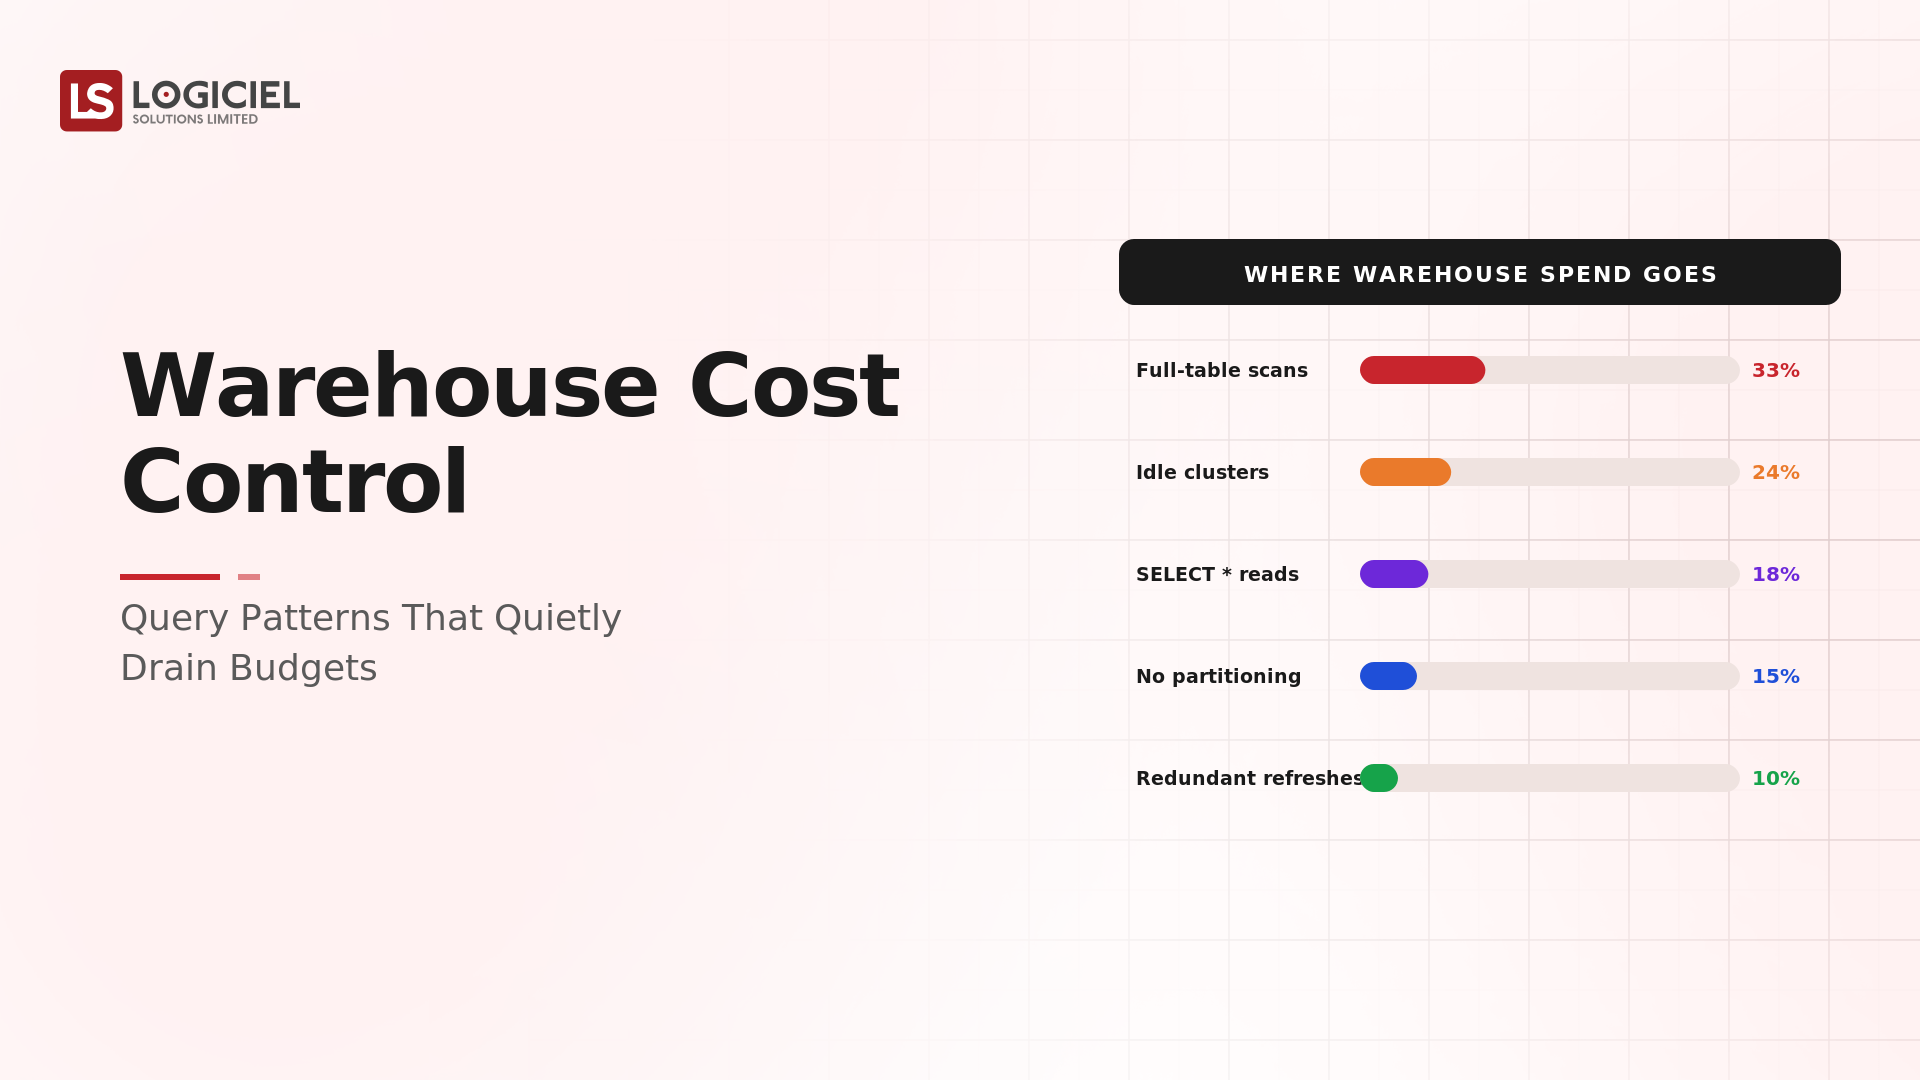
There is a developer productivity dashboard in your organization tracking lines of code, commits, and tickets closed, and it tells you almost nothing about how fast the team actually delivers. The numbers go up, activity is high, and delivery is still slow, blocked by long review waits, flaky pipelines, and painful deploys that the dashboard does not measure. The metrics being tracked are the visible, countable ones, not the ones that actually predict delivery speed.
This is more than a measurement gap. It is tracking DevEx vanity metrics instead of the ones that predict delivery.
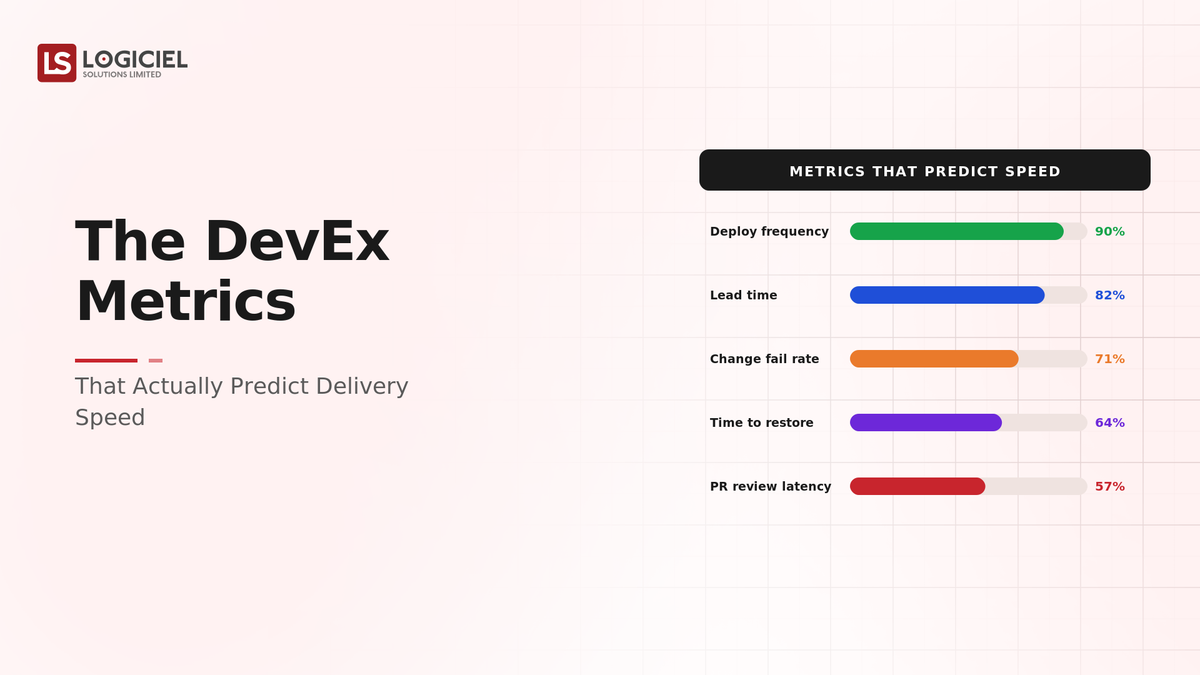
The DevEx metrics that actually predict delivery speed measure flow and friction, how long change takes to go from idea to production, how often it succeeds, how fast it recovers, and where developers are blocked, not activity like lines of code or commits. Activity metrics measure motion; delivery metrics measure throughput. Improving delivery speed requires measuring the friction in the path, not the volume of motion.
However, many teams track activity metrics that are easy to count and discover they measure busyness, not delivery, and improve nothing.
If you are an engineering leader measuring developer productivity, the intent of this article is:
- Define which DevEx metrics predict delivery speed and which are vanity
- Walk through flow, friction, and outcome metrics
- Lay out how to measure what improves delivery
To do that, let's start with the basics.
Why Smart CTOs Audit Vendors Before Signing
Inside a one-quarter overhead audit that pulled a five-person data team back from 67% firefighting.
What Are Delivery-Predictive DevEx Metrics? The Basic Definition
At a high level, delivery-predictive DevEx metrics measure the flow and friction of change, lead time, deployment frequency, change failure rate, recovery time, and where developers are blocked, rather than activity like lines of code or commits that measure motion, not throughput.
To compare:
If activity metrics are counting how many times a runner's legs move, delivery metrics are timing how fast they finish the race. The leg count is motion; the finish time is the outcome that matters.
Why Are Delivery-Predictive Metrics Necessary?
Issues that delivery-predictive metrics address or resolve:
- Measuring throughput, not activity
- Finding the friction that slows delivery
- Improving delivery speed by measuring what predicts it
Resolved Issues by Delivery-Predictive Metrics
- Replaces vanity activity metrics with delivery measures
- Surfaces the friction in the delivery path
- Lets improvement target what predicts speed
Core Components of Delivery-Predictive DevEx
- Lead time for change
- Deployment frequency
- Change failure rate and recovery time
- Friction points where developers are blocked
- Developer-reported experience
Modern DevEx Measurement Tooling
- Delivery metrics (DORA-style) from the pipeline
- Friction and bottleneck analysis
- Developer experience surveys
- Flow metrics across the path
- Dashboards on throughput, not activity
These tools measure delivery; the discipline is measuring flow and friction, not activity.
Other Core Issues They Will Solve
- Direct improvement at the real bottlenecks
- Distinguish busyness from delivery
- Provide a basis for DevEx investment
Importance of Delivery-Predictive Metrics in 2026
Measuring what predicts delivery matters more as DevEx investment grows. Four reasons explain why it matters now.
1. Activity metrics mislead.
Lines of code and commits measure motion, not delivery, and can rise while delivery slows. They mislead and can be gamed.
2. Friction is where speed is lost.
Delivery speed is lost to review waits, flaky pipelines, and painful deploys, friction the activity metrics do not capture.
3. You improve what you measure.
Measuring activity drives activity; measuring delivery and friction drives delivery improvement. The metric shapes behavior.
4. DevEx investment needs a target.
Improving DevExrequires knowing where the friction is, which delivery and friction metrics reveal and activity metrics do not.
Traditional vs. Delivery-Predictive Metrics
- Lines of code, commits vs. lead time, deployment frequency
- Activity vs. flow and friction
- Motion vs. throughput
- Gameable vanity vs. delivery outcomes
In summary: Delivery-predictive DevEx metrics measure flow, friction, and outcomes, not activity, so improvement targets what actually predicts delivery speed.
Details About the Components of Delivery-Predictive DevEx: What Are You Measuring?
Let's go through each metric.
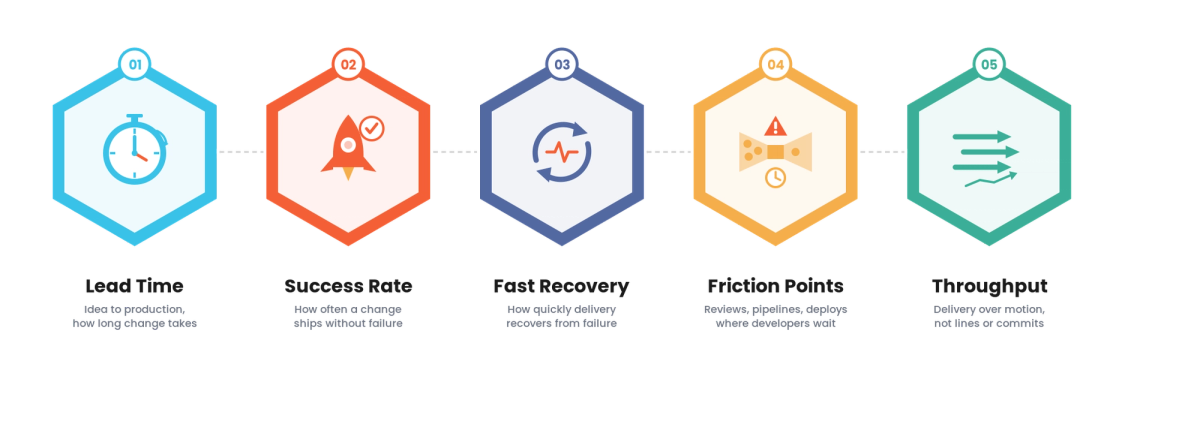
1. Lead Time Layer
Idea to production.
Lead time decisions:
- Time from change started to in production
- The end-to-end flow measured
- Bottlenecks within it found
2. Frequency Layer
How often you ship.
Frequency decisions:
- Deployment frequency
- Batch size and flow
- Small, frequent change favored
3. Stability Layer
How often it works.
Stability decisions:
- Change failure rate
- Recovery time
- Stability with speed
4. Friction Layer
Where developers are blocked.
Friction decisions:
- Review waits, pipeline flakiness, deploy pain
- Bottlenecks identified
- Friction quantified
5. Experience Layer
What developers report.
Experience decisions:
- Developer-reported experience
- Pain points surfaced
- Qualitative complementing quantitative
Benefits Gained from Measuring Delivery
- Improvement targeted at the real friction
- Throughput measured, not busyness
- DevEx investment directed where it speeds delivery
How It All Works Together
You measure the flow and friction of change rather than activity. Lead time captures how long change takes from idea to production, surfacing where it stalls. Deployment frequency and batch size show whether change flows in small, frequent increments or large, slow ones. Change failure rate and recovery time show whether speed comes with stability. Friction metrics, review waits, pipeline flakiness, deploy pain, identify where developers are blocked, complemented by developer-reported experience. The dashboard measures throughput and friction, not lines of code, so improvement targets the bottlenecks that actually slow delivery, and you can tell delivery improvement from busyness.
Common Misconception
More developer activity means faster delivery.
Activity, lines of code, commits, tickets, measures motion, not delivery, and can rise while delivery slows due to friction the activity metrics miss. Faster delivery comes from reducing friction in the path, which requires measuring flow and friction, not activity volume.
Key Takeaway: Activity is not delivery. Measuring lines of code drives motion; measuring lead time and friction drives delivery speed.
Real-World Delivery-Predictive Metrics in Action
Let's take a look at how delivery-predictive metrics operate with a real-world example.
We worked with a team tracking activity metrics while delivery stayed slow, with these constraints:
- Measure throughput, not activity
- Find the friction slowing delivery
- Improve what predicts speed
Step 1: Measure Lead Time
Idea to production.
- End-to-end change time
- Flow measured
- Bottlenecks found
Step 2: Measure Frequency and Stability
Flow and reliability.
- Deployment frequency and batch size
- Change failure rate and recovery time
- Speed with stability
Step 3: Identify Friction
Where blocked.
- Review waits, pipeline flakiness, deploy pain
- Bottlenecks identified
- Friction quantified
Step 4: Survey Experience
Developer-reported.
- Developer experience surveyed
- Pain points surfaced
- Qualitative added
Step 5: Target Improvement
At the friction.
- Improvement at the real bottlenecks
- Throughput tracked
- Vanity metrics dropped
Where It Works Well
- Lead time, frequency, stability, and friction measured
- Improvement targeted at the real bottlenecks
- Throughput distinguished from busyness
Where It Does Not Work Well
- Tracking lines of code, commits, tickets
- Measuring activity while delivery stays slow
- Improving nothing because the metric is motion
Key Takeaway: The DevEx metrics that improve delivery are the ones measuring flow and friction, not activity, so improvement targets what actually predicts speed.
Common Pitfalls
i) Tracking activity metrics
Lines of code and commits measure motion, mislead, and can be gamed. Measure flow and friction instead.
- Measure lead time
- Measure friction
- Drop vanity metrics
ii) Ignoring friction
Delivery speed is lost to friction the activity metrics miss. Identify and quantify the friction.
iii) Measuring speed without stability
Speed at the cost of stability is not delivery. Measure change failure rate and recovery alongside speed.
iv) Quantitative only
Metrics miss some pain. Complement with developer-reported experience.
Takeaway from these lessons: Most DevEx measurement fails by tracking activity, not delivery. Measure flow, friction, and outcomes, and target improvement at the bottlenecks.
Delivery-Predictive DevEx Best Practices: What High-Performing Teams Do Differently
1. Measure flow, not activity
Track lead time, deployment frequency, and batch size, the flow of change, not lines of code or commits.
2. Measure stability with speed
Track change failure rate and recovery time so speed comes with stability, not at its expense.
3. Identify and quantify friction
Find the review waits, pipeline flakiness, and deploy pain that block developers, and quantify them.
4. Complement with experience
Add developer-reported experience to capture pain the metrics miss.
5. Target improvement at the bottlenecks
Use the metrics to direct DevEx investment at the friction that actually slows delivery.
Logiciel's value add is helping engineering leaders measure the DevEx metrics that predict delivery, flow, friction, stability, and experience, so improvement targets the real bottlenecks rather than driving activity.
Takeaway for High-Performing Teams: Focus on flow and friction, not activity. The DevEx metrics that predict delivery speed measure throughput and the friction in the path; activity metrics measure motion and improve nothing.
Signals You Are Measuring DevEx Correctly
How do you know the metrics matter? Not in activity volume, but in delivery and friction. Below are the signals that distinguish delivery-predictive metrics from vanity.
Flow is measured. The team tracks lead time, deployment frequency, and batch size.
Stability is measured with speed. Change failure rate and recovery time are tracked.
Friction is identified. The team quantifies review waits, pipeline flakiness, and deploy pain.
Experience complements metrics. Developer-reported experience surfaces pain the metrics miss.
Improvement targets bottlenecks. DevEx investment goes to the friction that slows delivery.
Adjacent Capabilities and Connected Work
This work does not exist in isolation. DevEx measurement depends on, and feeds into, several adjacent capabilities. Building one without thinking about the others is the most common scoping mistake.
In most organizations, DevEx measurement shares infrastructure with the CI/CD pipeline, the version control and ticketing systems, and the engineering process. It shares capacity with platform engineering, engineering leadership, and the teams measured. And it shares leadership attention with whatever the next productivity initiative is on the roadmap. Naming these adjacencies upfront helps the program scope realistically and helps leadership see the work as a portfolio rather than a one-off project.
The most common mistake in adjacency-capability scoping is treating each adjacency as someone else's problem. The pipeline that emits delivery metrics is your problem. The friction in the path is your problem to find. The improvement at the bottlenecks is your problem. Pretending otherwise pushes work to teams that did not plan for it, and the work returns to you later as slow delivery the dashboard never explained. Own the adjacencies you depend on; partner with the teams that own them; share the timeline.
Conclusion
The DevEx metrics that actually predict delivery speed measure flow and friction, lead time, frequency, stability, and where developers are blocked, not activity like lines of code. The discipline that delivers it is the same discipline behind any measurement: measure the outcome and its drivers, not the motion.
Key Takeaways:
- Activity metrics measure motion, not delivery, and mislead
- Measure flow, friction, stability, and developer experience
- Target improvement at the friction that predicts delivery speed
Measuring DevEx well requires flow, friction, and outcome discipline. When done correctly, it produces:
- Improvement targeted at the real friction
- Throughput measured, not busyness
- DevEx investment directed where it speeds delivery
- Delivery improvement distinguishable from activity
What 100 CTOs Want in Tech Partners
This report shows what actually predicts delivery success and what CTOs discover too late.
What Logiciel Does Here
If your DevEx dashboard tracks lines of code and commits, switch to measuring flow and friction, lead time, frequency, stability, and bottlenecks, and target improvement there.
Learn More Here:
- Golden Paths: Paving the Road for Developer Productivity
- The Platform Team's First 90 Days: What to Build First
- The SLO Handbook: Setting Targets Your Team Can Actually Hit
At Logiciel Solutions, we work with engineering leaders on DevEx measurement, delivery metrics, and friction analysis. Our reference patterns come from production engineering organizations.
Explore the DevEx metrics that actually predict delivery speed.
Frequently Asked Questions
Which DevEx metrics predict delivery speed?
Flow and friction metrics: lead time for change, deployment frequency, change failure rate, recovery time, and the friction points where developers are blocked, complemented by developer-reported experience. These measure throughput and its drivers, not activity.
Why are lines of code and commits poor metrics?
Because they measure activity, motion, not delivery. They can rise while delivery slows due to friction they do not capture, and they can be gamed. Measuring them drives activity, not delivery improvement.
Where is delivery speed actually lost?
To friction in the path: long review waits, flaky pipelines, painful deploys, and other bottlenecks. Activity metrics do not capture this friction, so improving delivery requires measuring flow and identifying the friction.
Why measure stability alongside speed?
Because speed at the cost of stability, frequent failures and slow recovery, is not real delivery. Change failure rate and recovery time ensure that faster delivery comes with reliability, not at its expense.
What is the biggest mistake in measuring developer productivity?
Tracking activity metrics like lines of code, commits, and tickets closed, because they are easy to count. They measure motion, mislead, and can be gamed, while delivery stays slow. Measure flow, friction, and outcomes, and target improvement at the bottlenecks.