There is a portfolio analysis in your real estate organization that lives in a spreadsheet, maintained by one person, pulling numbers from half a dozen systems by hand each month. It answers the questions leadership asks, until the person is out, a formula breaks silently, or two stakeholders open different versions and disagree on the numbers. The portfolio is run on a spreadsheet that has quietly become critical infrastructure, with none of the reliability that critical infrastructure requires.
This is more than spreadsheet sprawl. It is portfolio analytics on spreadsheets where a platform is needed.
Moving real estate portfolio analytics from spreadsheets to a platform is more than buying a tool. It is establishing automated data flow from source systems, a single source of truth for portfolio metrics, and reliable, consistent analytics that the whole organization shares, so portfolio decisions rest on a platform rather than a fragile, person-dependent spreadsheet.
However, many organizations run on spreadsheets long past the point where the portfolio's scale and stakes demand a platform, and discover the risk when the spreadsheet breaks or disagrees.
If you are a real estate or data leader running portfolio analytics, the intent of this article is:
- Define what moving to a platform actually requires
- Walk through automated data flow and a single source of truth
- Lay out the controls reliable portfolio analytics needs
To do that, let's start with the basics.
Best-Of-Breed Stacks Become Hidden Technical Tax
Inside a 7-month consolidation that cut six tools to one and saved $1.4M.
What Is a Portfolio Analytics Platform? The Basic Definition
At a high level, a real estate portfolio analytics platform is a system with automated data flow from source systems, a single source of truth for portfolio metrics, and consistent, reliable analytics shared across the organization, replacing person-dependent spreadsheets.
To compare:
If a spreadsheet is a hand-built ledger one clerk maintains, a platform is an accounting system the whole firm relies on. The ledger works until the clerk is unavailable or makes an error; the system is reliable, consistent, and shared.
Why Is Moving to a Platform Necessary?
Issues that moving to a platform addresses or resolves:
- Removing person-dependence and fragility from portfolio analytics
- Establishing a single source of truth for metrics
- Providing consistent, reliable analytics across the organization
Resolved Issues by a Platform
- Replaces fragile spreadsheets with automated, reliable analytics
- Gives one agreed version of portfolio metrics
- Removes silent errors and version disagreements
Core Components of a Portfolio Analytics Platform
- Automated data flow from source systems
- A single source of truth for portfolio metrics
- Consistent, defined metrics
- Reliable, shared analytics and reporting
- Governance and quality
Modern Portfolio Analytics Tooling
- Data integration from property and financial systems
- A central data store or warehouse
- Defined metrics and a semantic layer
- BI and analytics tools
- Data quality and governance
These tools support a platform; the discipline is automated data flow and a single source of truth, not another spreadsheet.
Other Core Issues They Will Solve
- Support portfolio decisions on reliable data
- Scale analytics as the portfolio grows
- Provide an audit trail for reported figures
Importance of a Platform in 2026
Moving to a platform matters more as portfolios and stakes grow. Four reasons explain why it matters now.
1. Spreadsheets become critical infrastructure unnoticed.
A spreadsheet that runs portfolio decisions is critical infrastructure with none of the reliability critical infrastructure needs, person-dependent and fragile.
2. Silent errors are costly.
A broken formula or a wrong manual entry can drive a portfolio decision unnoticed. A platform with defined metrics and quality checks reduces that risk.
3. Disagreement undermines decisions.
Different spreadsheet versions produce different numbers. A single source of truth ends the disagreement.
4. Scale outgrows manual assembly.
As the portfolio grows, manual data assembly does not scale. Automated data flow does.
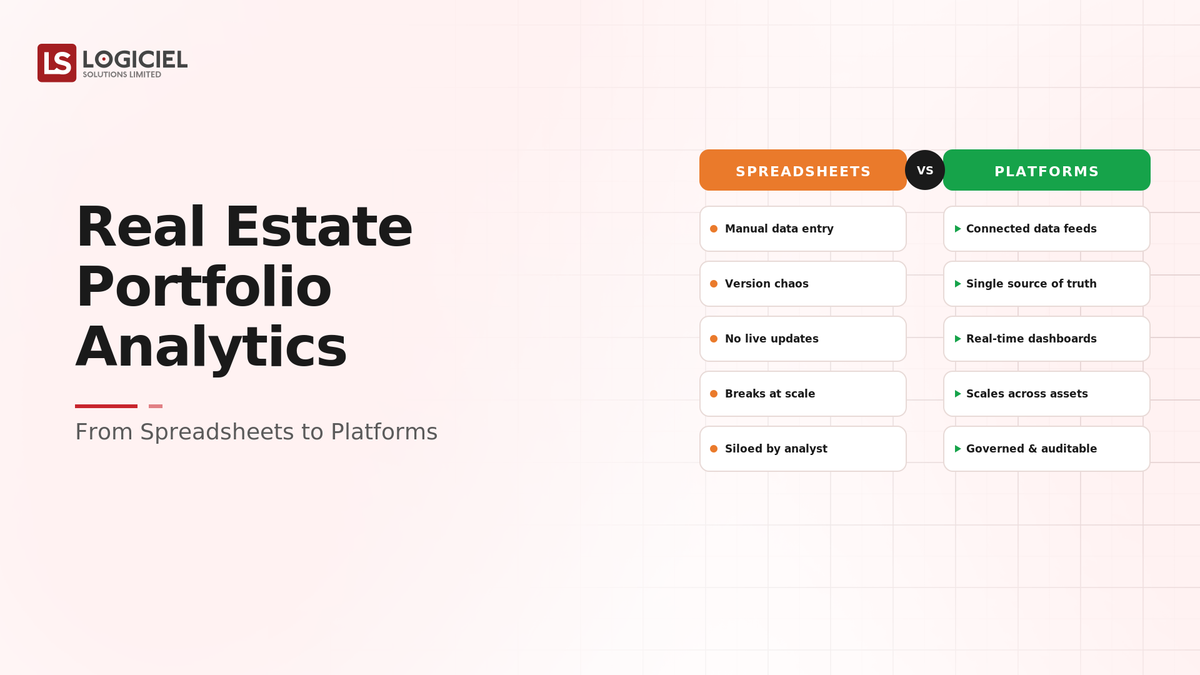
Traditional vs. Platform Analytics
- Person-dependent spreadsheet vs. automated platform
- Manual data assembly vs. automated data flow
- Multiple disagreeing versions vs. a single source of truth
- Fragile and silent errors vs. reliable, quality-checked analytics
In summary: A portfolio analytics platform provides automated data flow, a single source of truth, and reliable shared analytics, replacing fragile spreadsheets.
Details About the Core Components of a Portfolio Analytics Platform: What Are You Designing?
Let's go through each layer.
1. Data Flow Layer
Getting data in automatically.
Data flow decisions:
- Automated ingestion from source systems
- No manual monthly assembly
- Handling of varied sources
2. Source of Truth Layer
One agreed version.
Source of truth decisions:
- A central store of portfolio data
- One agreed version of metrics
- Versions and disagreements eliminated
3. Metric Layer
Consistent definitions.
Metric decisions:
- Defined, consistent portfolio metrics
- Metrics computed once, used everywhere
- A semantic layer for definitions
4. Analytics Layer
Reliable, shared output.
Analytics decisions:
- Reliable, consistent analytics and reporting
- Shared across the organization
- Self-service where appropriate
5. Quality Layer
Ensuring reliability.
Quality decisions:
- Data validation and quality checks
- Anomaly detection
- Governance and audit
Benefits Gained from a Platform
- Portfolio analytics that are reliable and not person-dependent
- One agreed version of metrics across the organization
- Consistent, auditable data for portfolio decisions

How It All Works Together
Data flows automatically from the property and financial source systems into a central store, removing the manual monthly assembly. Portfolio metrics are defined consistently and computed once, in a semantic layer, so everyone uses the same definitions and there is one agreed version of the truth, ending version disagreements. Reliable analytics and reporting are shared across the organization, with self-service where appropriate. Data validation, anomaly detection, and governance ensure the figures are reliable and auditable. Portfolio decisions rest on a platform that runs and can be trusted, rather than a fragile spreadsheet that one person maintains and that breaks or disagrees.
Common Misconception
Our portfolio spreadsheet works, so a platform is a nice-to-have.
A spreadsheet that runs portfolio decisions has become critical infrastructure, and its person-dependence, fragility, silent errors, and version disagreements are real risks the more the portfolio relies on it. A platform is not a nice-to-have once the spreadsheet is load-bearing; it is the reliability the stakes require.
Key Takeaway: A load-bearing spreadsheet is a risk, not a solution. A platform provides the reliability, single truth, and scale that portfolio decisions need.
Real-World Platform Migration in Action
Let's take a look at how moving to a platform operates with a real-world example.
We worked with an organization running portfolio analytics on a spreadsheet, with these constraints:
- Remove person-dependence and fragility
- Establish a single source of truth
- Provide reliable, shared analytics
Step 1: Automate Data Flow
Replace manual assembly.
- Automated ingestion from source systems
- Manual monthly assembly removed
- Varied sources handled
Step 2: Establish a Single Source of Truth
End disagreements.
- Central store of portfolio data
- One agreed version of metrics
- Versions eliminated
Step 3: Define Consistent Metrics
Standardize the numbers.
- Defined, consistent metrics
- Computed once, used everywhere
- Semantic layer for definitions
Step 4: Provide Shared Analytics
Make it reliable and shared.
- Reliable analytics and reporting
- Shared across the organization
- Self-service where appropriate
Step 5: Ensure Quality
Make figures reliable.
- Validation and quality checks
- Anomaly detection
- Governance and audit
Where It Works Well
- Automated data flow replacing manual assembly
- A single source of truth ending version disagreements
- Consistent metrics and reliable, shared analytics
Where It Does Not Work Well
- A load-bearing, person-dependent spreadsheet
- Manual assembly that breaks silently or disagrees
- No defined metrics, so numbers differ by version
Key Takeaway: The portfolio analytics that decisions can rest on are the ones on a platform with automated data flow and a single source of truth, not the fragile spreadsheet that has become critical infrastructure.
Common Pitfalls
i) Running on a load-bearing spreadsheet
A spreadsheet that runs portfolio decisions is fragile, person-dependent infrastructure. Move to a platform once it is load-bearing.
- Automate data flow
- Establish a single truth
- Define metrics consistently
ii) No single source of truth
Multiple spreadsheet versions produce disagreeing numbers. Establish one agreed version.
iii) Undefined metrics
Numbers computed differently by version differ. Define metrics once and use them everywhere.
iv) No data quality
Manual data carries silent errors. Validate, detect anomalies, and govern figures.
Takeaway from these lessons: Most portfolio analytics risk traces to load-bearing spreadsheets and undefined metrics, not to the analysis. Automate data flow, establish a single truth, and define metrics.
Portfolio Analytics Best Practices: What High-Performing Teams Do Differently
1. Automate the data flow
Ingest from source systems automatically so analytics are not a manual monthly assembly that breaks or depends on one person.
2. Establish a single source of truth
A central store and one agreed version of metrics end the version disagreements that undermine decisions.
3. Define metrics consistently
Compute metrics once in a semantic layer and use them everywhere, so numbers agree across the organization.
4. Share reliable analytics
Provide consistent, reliable analytics and reporting across the organization, with self-service where appropriate.
5. Ensure data quality and governance
Validate data, detect anomalies, and govern figures so portfolio decisions rest on reliable, auditable data.
Logiciel's value add is helping real estate teams move portfolio analytics from spreadsheets to a platform, with automated data flow, a single source of truth, and consistent metrics, so portfolio decisions rest on reliable, shared data.
Takeaway for High-Performing Teams: Focus on automated data flow and a single source of truth. A portfolio analytics platform replaces a fragile, person-dependent spreadsheet with reliable, consistent, shared analytics the stakes require.
Signals You Are Moving to a Platform Correctly
How do you know the analytics are sound? Not in whether they answer questions, but in their reliability and consistency. Below are the signals that distinguish a platform from a spreadsheet.
Analytics are not person-dependent. The team can produce portfolio analytics from a platform that runs, not a spreadsheet one person maintains.
There is a single source of truth. Stakeholders cite the same numbers because there is one agreed version.
Metrics are defined and consistent. Numbers agree across reports because metrics are computed once and used everywhere.
Data flows automatically. The team ingests from source systems automatically, not by manual monthly assembly.
Figures are reliable. The team validates data and detects anomalies, so silent errors are caught.
Adjacent Capabilities and Connected Work
This work does not exist in isolation. A portfolio analytics platform depends on, and feeds into, several adjacent capabilities. Building one without thinking about the others is the most common scoping mistake.
In most real estate organizations, portfolio analytics shares infrastructure with the property and financial source systems, the data platform, and the reporting process. It shares capacity with data engineering, the analytics team, and the leadership consuming the numbers. And it shares leadership attention with whatever the next data initiative is on the roadmap. Naming these adjacencies upfront helps the program scope realistically and helps leadership see the work as a portfolio rather than a one-off project.
The most common mistake in adjacent-capability scoping is treating each adjacency as someone else's problem. The source systems the data flows from are your problem to integrate. The metric definitions are your problem. The reporting consuming the analytics is your problem. Pretending otherwise pushes work to teams that did not plan for it, and the work returns to you later as a disagreeing or broken report. Own the adjacencies you depend on; partner with the teams that own them; share the timeline.
Conclusion
Moving real estate portfolio analytics from spreadsheets to a platform replaces fragile, person-dependent analysis with automated data flow, a single source of truth, and reliable shared analytics. The discipline that delivers it is the same discipline behind any analytics platform: automate the data, define the metrics, and make the output reliable and shared.
Key Takeaways:
- A load-bearing portfolio spreadsheet is a risk, not a solution
- A platform provides automated data flow and a single source of truth
- Define metrics consistently and ensure data quality and governance
Moving to a platform well requires data-flow, single-truth, and quality discipline. When done correctly, it produces:
- Portfolio analytics that are reliable and not person-dependent
- One agreed version of metrics across the organization
- Consistent, auditable data for portfolio decisions
- Analytics that scale as the portfolio grows
Why CFOs Reject Technical Infrastructure Cases
Inside a 5-step framework that won $500K of infrastructure budget in 14 days.
What Logiciel Does Here
If your portfolio analytics run on a load-bearing spreadsheet, automate the data flow, establish a single source of truth, and define metrics consistently on a platform.
Learn More Here:
- The Semantic Layer: One Definition of Revenue, Finally
- Commercial Real Estate AI: Asset Management and Investment Analytics
- PropTech Data Integration: Taming the MLS-CRM-ERP Triangle
At Logiciel Solutions, we work with real estate and data leaders on portfolio analytics platforms, data integration, and metric governance. Our reference patterns come from production analytics platforms.
Explore how to move your portfolio analytics from spreadsheets to a platform.
Frequently Asked Questions
What is a real estate portfolio analytics platform?
A system with automated data flow from source systems, a single source of truth for portfolio metrics, and consistent, reliable analytics shared across the organization, replacing the person-dependent spreadsheets many organizations use to run portfolio decisions.
Why move off spreadsheets if they work?
Because a spreadsheet that runs portfolio decisions has become critical infrastructure with none of the reliability critical infrastructure needs: it is person-dependent, fragile, prone to silent errors, and produces disagreeing versions. Once it is load-bearing, a platform is the reliability the stakes require.
What is a single source of truth in portfolio analytics?
A central store with one agreed version of portfolio metrics that the whole organization uses, so different stakeholders cite the same numbers rather than disagreeing because they opened different spreadsheet versions.
Why do metrics need to be defined consistently?
Because numbers computed differently across spreadsheet versions disagree, undermining decisions. Defining metrics once, in a semantic layer, and using them everywhere ensures the numbers agree across all reports and users.
What is the biggest mistake in portfolio analytics?
Running portfolio decisions on a load-bearing spreadsheet long past the point where the scale and stakes demand a platform. The fragility, person-dependence, silent errors, and version disagreements are real risks. Automate the data flow, establish a single source of truth, and define metrics.