Your organisation has modernised the data stack.
You have increased the speed of your pipelines. Decreased system failure. You have made systems more scalable.
But when your senior team asks….what do we receive from this investment?
Answering that question is unclear.
This is the problem of Measuring Data Infrastructure ROI.
AI Velocity Blueprint
Measure and multiply engineering velocity using AI-powered diagnostics and sprint-aligned teams.
This guide is aimed at infrastructure owners such, as a CTO, VP Engineering and Head of Data. You will learn to:
- Understand why Measuring ROI from data systems has been a challenge
- Learn to quantify the impact of the data infrastructure using Functional Frameworks
- Communicate the value to your business stakeholders in a way that is relevant for them
So let's start out with the basic problem…
Why Pricing ROI from Data Infrastructure is a Challenge
1. Indirect Value
Data Infrastructure influences:
- Decision-making
- Product Performance
- Customer Experience

However, these values are not always measurable (direct).
2. Cost Is Known, Benefits Untold
The Finance team can see:
- Data Infrastructure costs
- Tooling costs
- Cost of Engineering talent
However, some value such as reliability, can be difficult to communicate.
3. Difficulty to Attribute
Attributing improvements made to a system to business performance is complex.
4. Timeframe Lag between Investment and Value
The benefits from a data infrastructure investment are realised:
- Through many months after implementation is complete
- Across multiple departments
So What This Means Is…
Without a clear identification of ROI, investments in a data infrastructure will be questioned, budget levels will be reduced, and funds to execute your company's strategic initiatives will be less visible.
Conclusion:
To measure your data infrastructure's ROI (return on investment), technical improvements should be translated into Business value.
Evaluating Return from Investments (ROI): Categories
Cost Savings
Some examples of cost savings are:
- Reduced infrastructure cost
- Lower on-going operating expenses
- Elimination of redundant systems
Efficiency
Examples of an efficiency gain would be:
- A decrease in the amount of time it takes to conduct engineering
- Acceleration in the ability to execute pipelines
- Reduction in the amount of time spent debugging
Increased Revenue
Examples of things that give you a greater revenue include:
- Enhancing the quality of your decisions
- Being able to get insight from your operations quicker
- Increasing the performance of your product or service
Risk Mitigation
Types of ways you can mitigate risks would be:
- Reducing failures accessing data
- Improving compliance
- Reducing instances of downtime
Summary
| ROI Category | Examples of Contributions |
|---|---|
| Cost Savings | Reduced Costs on Cloud Services |
| Increased Efficiency | Reduced engineering time |
| Increased Revenue | Improved speed of decision making |
| Reduced Risk | Less downtime |
In Conclusion:
There are many different ways to evaluate ROI.
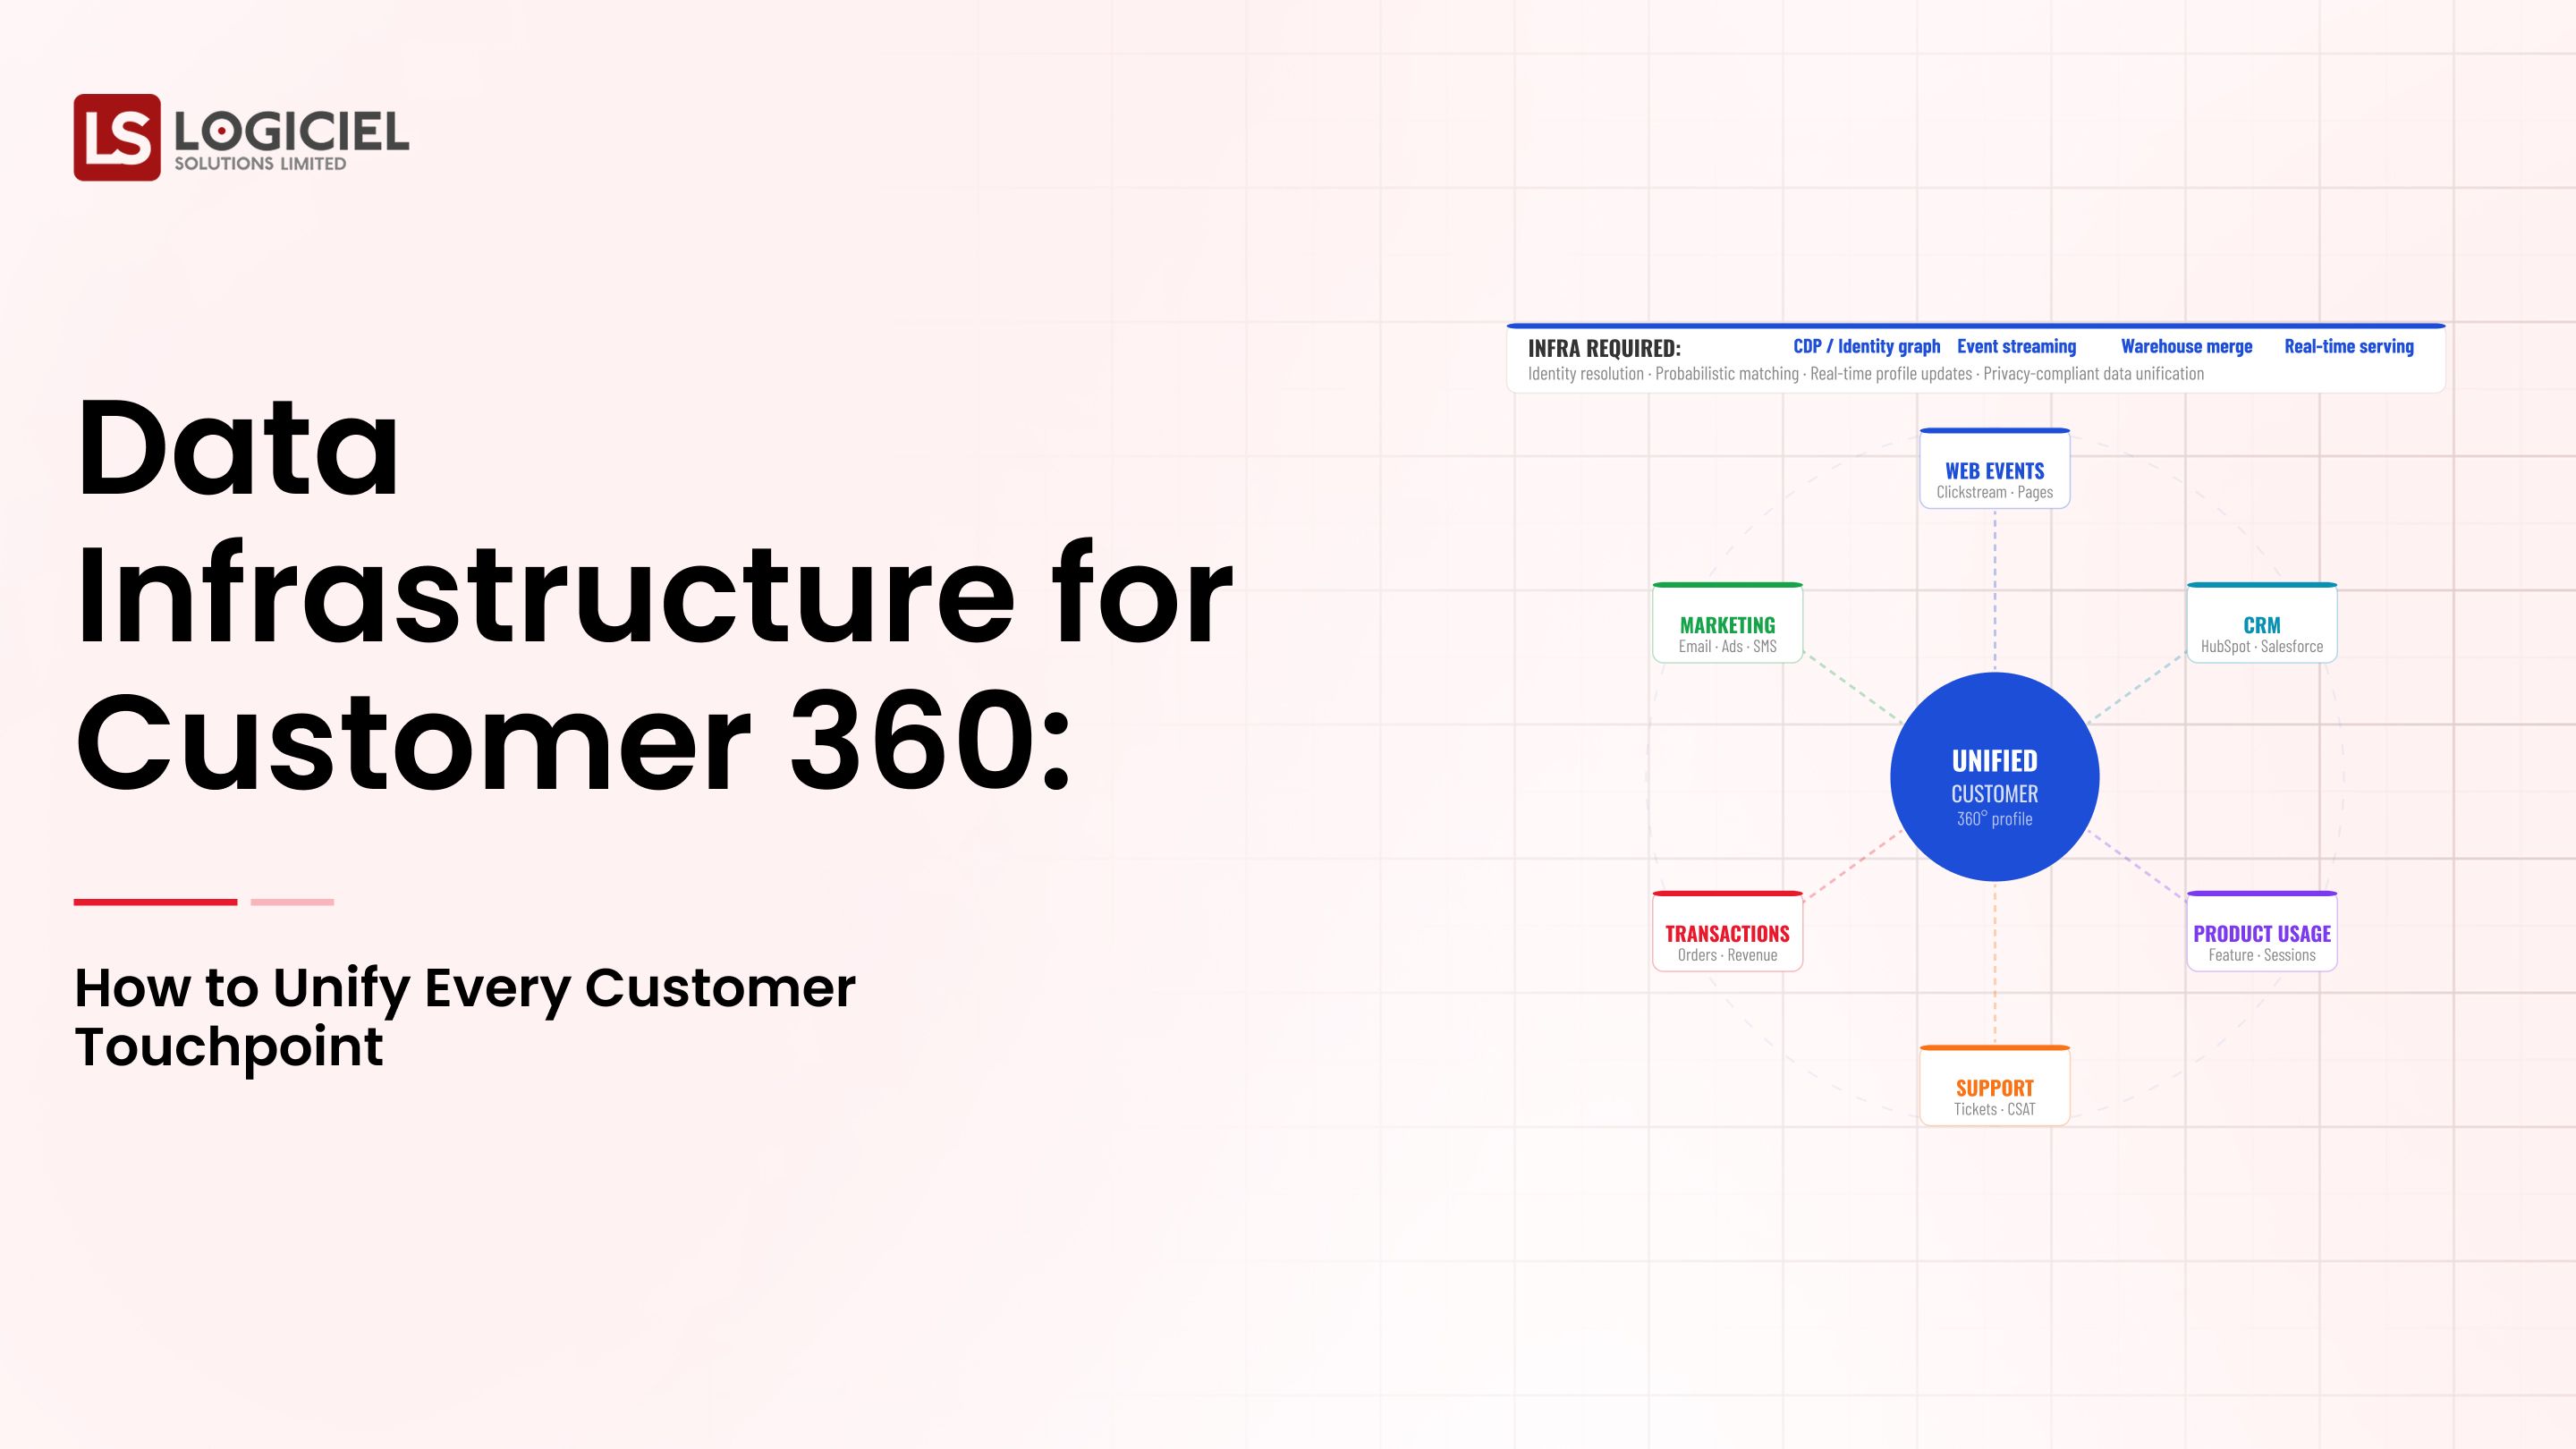
Using the ROI Framework to Evaluate Your Data Infrastructure
Step One: Gather Baseline Metrics
You will want to track your pipeline failure rates, data latency issues, and amount of engineering hours associated with that data.
Step Two: Measure Improvement
After you have completed implementation, you will want to compare before and after performance and track how many failures were present before vs. after implementations, and how many total hours have been saved since the implementation.
Step Three: Determine The Financial Value of the Metrics
You will have to convert your metrics to financial form, thus:
- A reduction of engineering cost equals savings
- Reduced downtime equals revenue protection
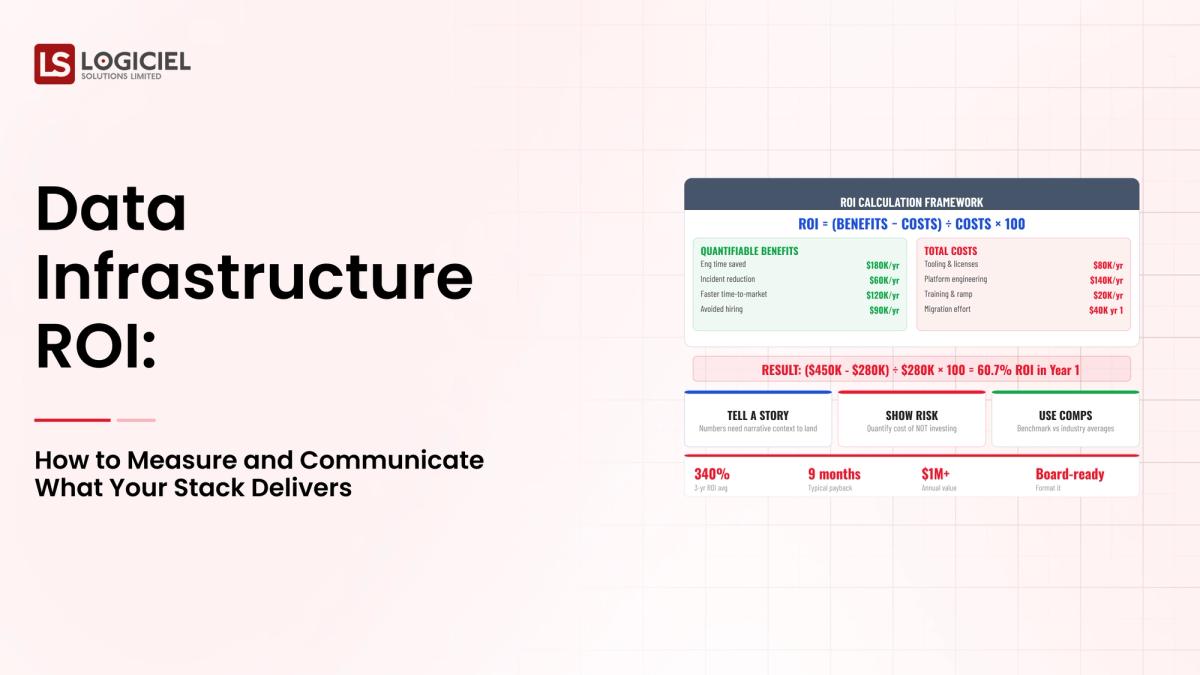
Step Four: Calculate ROI
Thus:
ROI = (Benefit - Cost)/Cost
Example of ROI calculation
| Metric | Before | After | Impact |
|---|---|---|---|
| Total Monthly Failures | 20 | 5 | (3/4) = 75% Reduction |
| Total Engineering Hours | 200 | 80 | 120 Hours Saved |
Financial Translation
- 120 Hours Saved = $12,000/month
- Reduced Downtime = $20,000/month
Total:
- Benefit = $32,000/month
- Cost = $10,000/month
- ROI = 220%
Conclusion:
Through more accurately measuring operational improvements, the benefits become easier to quantify.
How to Measure ROI in Practice with Real-World Example
Scenario: Software as a Service
The system you handle consists of:
- User Analytics
- Transaction Management
- Reporting
Step One: Review Pain Points
- Frequent pipeline failures
- Slow queries
- High costs
Step Two: Implement Procedures
- Optimize pipelines
- Increase observability
- Minimize redundancy
Step Three: Measure Results
- 50% decrease in failures
- 30% increase in query performance
- 20% savings on costs
Step Four: Convert Into Business Value
- Faster insights = Better decisions
- Less failures = More confidence
Where Everything Worked Well
- Establish clear metrics
- Demonstrated measurable improvements
Where Teams Failed
- Did not establish baseline data
- Did not translate into dollars
Take-away:
Measurements should be built into the system.
Common Mistakes Teams Make When Measuring ROI
1. Focus Just on Cost Savings
Do not include:
- Revenue generation
- Efficiency improvements
2. Do Not Keep Track of Baseline Metrics
No baseline means:
- No means of comparison
- No means of measuring improvements
3. Overcomplicated Calculations
Complex models will:
- Confuse stakeholders
- Devalue clarity
4. Poor Communication
Technical metrics:
- Have little or no impact with executives
Take-away:
Keep it simple and clear.
How to Communicate Data Infrastructure ROI to Stakeholders
1. Use Business Speak
Instead of:
"Latency reduction"
Say:
"Improved decision-making speed"
2. Focus on Results
Emphasize:
- Cost savings
- Revenue generation
- Risk reduction
3. Use Visual Dashboards
Showcase:
- ROI metrics
- Performance improvements
4. Align with Business Goals
Link ROI to:
- Growth
- Efficiency
- Risk mgt.
5. Use AI-First Insights
Leading teams are not satisfied with static reports.
Leading teams employ systems that:
- Automatically track ROI
- Surface insights
- Optimize performance
This is the value Logiciel Solutions can deliver.
By using Logiciel, teams gain real-time visibility of their infrastructure ROI and performance.
Takeaway:
Communication is as important as Measurements.
Conclusion
Measuring the ROI of data infrastructure is critical in today's world.
Here are three key takeaways:
- ROI must translate technical KPIs into business value
- Having a structured framework will create measurable and clear evaluations of ROI
- Communicating effectively will keep stakeholders in alignment
It is effort to complete this process.
However, completed correctly it unlocks:
- Stronger business cases
- Faster approval processes
- Better investment in systems
- Alignment across teams
Evaluation Differnitator Framework
Why great CTOs don’t just build they evaluate. Use this framework to spot bottlenecks and benchmark performance.
Call to Action
If you are having trouble showing the value of your data infrastructure, your next step will be to launch a clear framework of how you will measure ROI.
Further Reading:
- How to Justify Data Infrastructure Expenditures to Your CFO
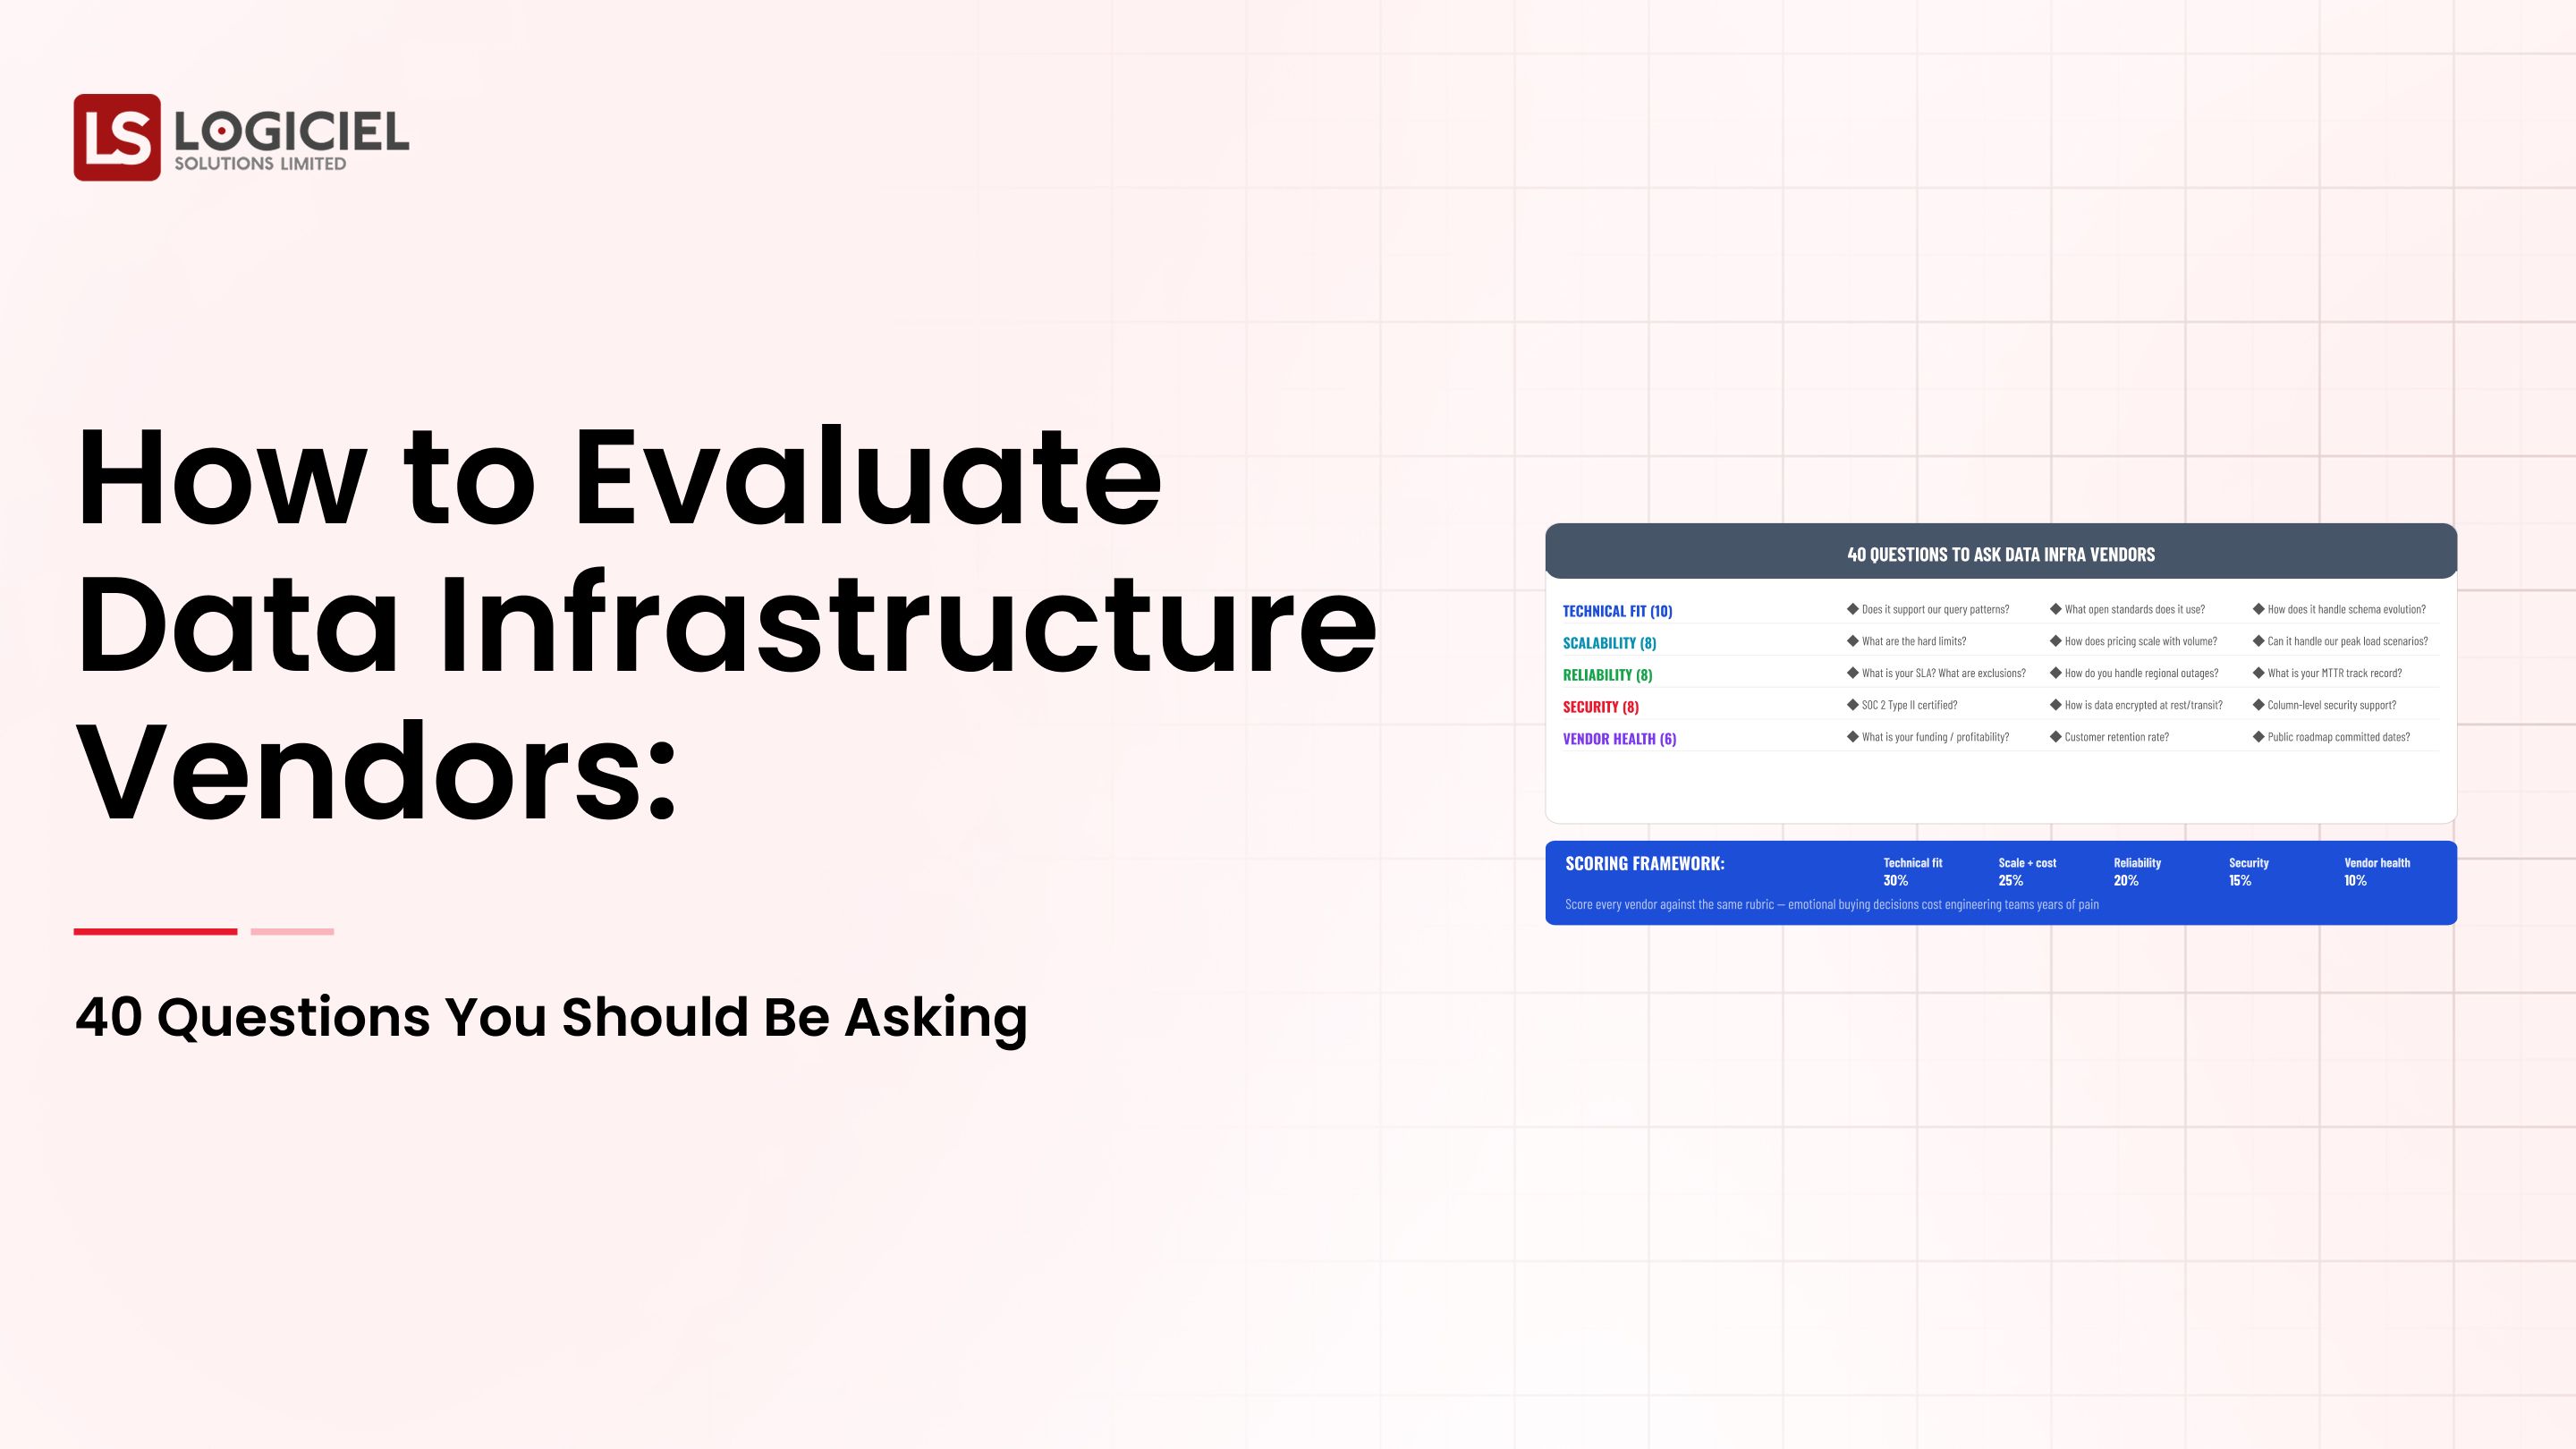
- Data Infrastructure Vendor Evaluation Process
- Where are the bottlenecks in my data infrastructure? Root causes and solutions
At Logiciel Solutions, we help customers to build AI-driven data infrastructures that will allow for quantifiable business impact.
Frequently Asked Questions
What is the ROI of data infrastructures?
The measurable impact created by a data infrastructure investment using the following methods; cost savings, efficiency gains and revenue impacts.
Why is ROI difficult to measure?
The benefits of data infrastructures are indirect and cannot be attributed to one particular change. Many changes will create positive benefits.
What metrics can I track?
Pipeline performance, failure rates, engineering labor and cost savings.
How can I communicate ROI to executives?
Use Biz speak, focus on results and provide clear financial metrics.
What is the single largest mistake made in measuring ROI?
Failure to connect the technical KPIs to business impact.