
An energy company exposes natural language querying over its operational data warehouse. An analyst asks for average consumption by site last quarter and gets a number. What the query did was average the interval readings present, silently ignoring that one site had eleven days of missing data, so its quarterly average reflects the period it happened to report rather than the quarter.
The query is correct. The answer is wrong in a way that no amount of query review catches, because the gap is not in the data and therefore not in the query.
The dangerous queries over time-series data are the ones that average around gaps and say nothing about it.
Text-to-SQL for energy means generating queries over a curated semantic layer where interval expectations, unit handling, and gap treatment are encoded, so answers state their completeness rather than silently averaging around missing readings.
What Spider 2.0 and EntSQL 2026 Reveal About Text-to-SQL in Production
Understand where text-to-SQL benchmarks expose real production readiness gaps.
However, most deployments treat the warehouse as a normal analytical database, where missing rows are absent rather than meaningful, which is the opposite of true in time-series data.
If you are a CDO or VP of Data at an energy company, the intent of this article is:
- Define why gaps make time-series querying different
- Show how unit and interval mismatches produce silent errors
- Lay out how answers can state their own completeness
To do that, let's start with the basics.
What Is Text-to-SQL for Energy? The Basic Definition
At a high level, text to SQL turns a natural language question into a query and returns a result. Over energy time-series data three things make that harder than it looks. Gaps are meaningful, because a missing interval is a missing measurement rather than an absent row, and averaging around it produces a number that describes a different period than the one asked about.
Units and intervals vary between sources, so summing across them without conversion is silently wrong. And aggregation semantics matter, because averaging averages is not the same as averaging the underlying readings. A semantic layer encoding all three is what makes generation safe.
To compare:
Querying time-series data with standard analytical assumptions is like calculating a monthly average temperature from a thermometer that was unplugged for a fortnight. The arithmetic is correct on the readings available. The answer describes two weeks and is labelled as a month, and nothing in the calculation reveals the substitution.
Why Does Text-to-SQL Matter for Energy?
Issues that it addresses or resolves:
- Queries averaging around gaps without stating completeness
- Unit and interval mismatches summed silently
- Engineers waiting on analysts for routine operational questions
Resolved Issues by Text-to-SQL Done Well
- Answers stating the completeness of the period they cover
- Units and intervals reconciled centrally
- Routine operational questions answered directly
Core Components of Text-to-SQL in Energy
- A curated semantic layer with interval expectations encoded
- Unit normalisation handled centrally
- Gap treatment defined and reported with results
- Aggregation semantics specified per metric
- Query and completeness shown with every answer
Modern Text-to-SQL Tooling for Energy
- Semantic layers exposing normalised metrics
- Interval completeness computed alongside aggregates
- Unit conversion applied in the layer
- Generation constrained to curated metrics
- Completeness and query displayed with results
These tools make time-series querying honest. Computing completeness alongside every aggregate is the change that turns a plausible average into a qualified one.
Other Core Issues They Will Solve
- Comparisons between sites that account for reporting differences
- Consistent unit handling across heterogeneous sources
- Fewer analyst hours on routine lookups
In Summary: Text to SQL for energy works when the semantic layer encodes interval expectations, units, and gap treatment, so answers report their own completeness.
Importance of Text-to-SQL for Energy in 2026
Operational questions are frequent and time-series data is unforgiving. Four reasons explain why this matters now.
1. Gaps are normal and meaningful.
Physical assets lose connectivity, and an average computed over what reported is not an average over the period.
2. Units and intervals differ by source.
Meters, sensors, and historians report at different granularity in different units, and summing across them naively is wrong.
3. Engineers ask operational questions constantly.
Routine lookups consume analyst capacity that could go to genuine investigation.
4. Plausible wrong answers inform operational decisions.
A site comparison distorted by reporting gaps can misdirect maintenance attention.
Traditional vs. Modern Energy Analytics Access
- Standard analytical assumptions vs. time-series semantics encoded
- Gaps ignored vs. completeness computed and reported
- Units assumed consistent vs. normalised in the layer
- Answers returned bare vs. with completeness and query shown
In summary: A modern energy approach encodes interval and unit semantics centrally and reports completeness with every aggregate.
Details About the Core Components of Text-to-SQL in Energy: What Are You Designing?
Let's go through each component.
1. Interval Layer
Expected versus present.
Interval decisions:
- Expected interval frequency defined per asset
- Completeness computed alongside aggregates
- Reporting periods distinguished from calendar periods
2. Unit Layer
Normalised centrally.
Unit decisions:
- Conversion applied in the semantic layer
- Source units documented
- Mixed unit aggregation prevented
3. Gap Layer
What happens to missing readings.
Gap decisions:
- Treatment defined per metric
- Interpolation marked if used
- Completeness reported with the result
4. Aggregation Layer
Semantics that matter.
Aggregation decisions:
- Averaging semantics specified per metric
- Weighted aggregation where required
- Averages of averages prevented
5. Transparency Layer
Showing the basis.
Transparency decisions:
- Completeness displayed with the number
- Query available on request
- Gap treatment stated
Benefits Gained from Text-to-SQL in Energy
- Answers that state how complete the underlying period was
- Comparisons that account for reporting differences
- Routine operational questions answered without a queue
How It All Works Together
The energy data team encodes time-series semantics in the semantic layer before exposing any natural language interface. Expected interval frequency is defined per asset, so completeness can be computed alongside every aggregate rather than inferred later, and an answer covering a quarter where one site reported for eleven fewer days says so.
Units are normalised centrally, since meters, sensors, and historians report in different units at different granularity and a query summing across them without conversion is silently wrong. Gap treatment is defined per metric, with interpolation marked in the data if it is used, so an answer never presents inferred values as measured ones.
Aggregation semantics are specified, which prevents the common error of averaging pre-averaged values and producing a figure that weights small sites equally with large ones. Generation is constrained to these curated metrics rather than the raw schema.
And every answer displays completeness, gap treatment, and access to the query, which is what makes a plausible number checkable.
Common Misconception
If the query is correct, the answer is correct.
Correctness in time-series querying has an additional dimension that standard analytical thinking omits. A query that averages the readings present is arithmetically correct and answers a different question from the one asked, because the question was about a quarter and the readings cover the portion of the quarter that reported.
Nothing in the query is wrong, nothing in a query review would flag it, and the result is a number that describes an unstated period. This is why completeness has to be computed and reported alongside the aggregate rather than being available on request.
The alternative is a system that produces correct queries and misleading answers, which is harder to catch than one that produces errors.
Key Takeaway: A correct query over incomplete intervals answers a different question. Completeness must be reported, not available on request.
Real-World Text-to-SQL for Energy in Action
Let's take a look at how it operates with a real-world example.
We worked with an energy data team whose site averages silently excluded eleven days of missing readings, with these constraints:
- Compute completeness alongside every aggregate
- Normalise units in the semantic layer
- State gap treatment with every answer
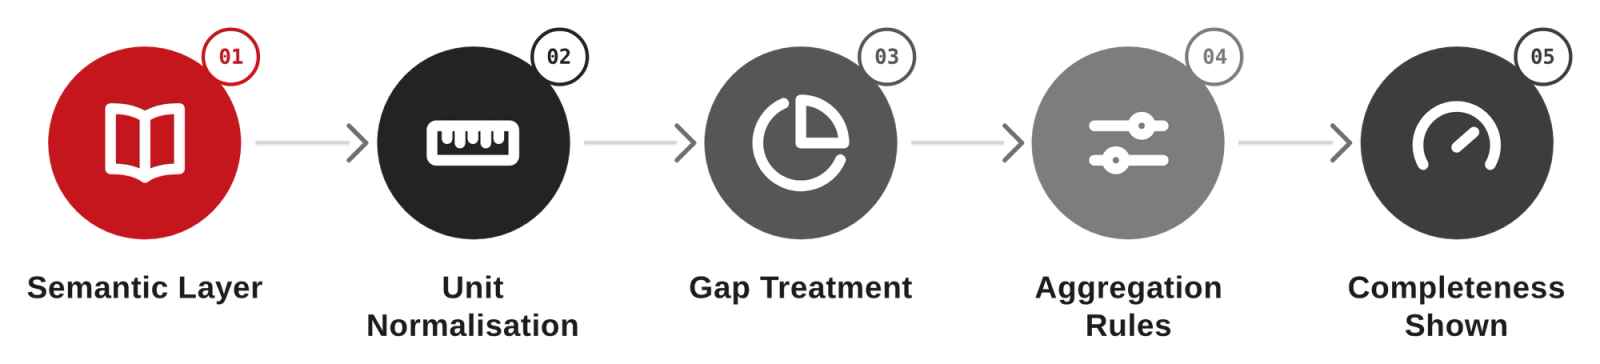
Step 1: Define Expected Intervals
Per asset.
- Expected frequency documented
- Completeness computed with aggregates
- Reporting period distinguished from calendar
Step 2: Normalise Units
Centrally.
- Conversion in the semantic layer
- Source units documented
- Mixed aggregation prevented
Step 3: Define Gap Treatment
Per metric.
- Treatment stated explicitly
- Interpolation marked if used
- Completeness reported
Step 4: Specify Aggregation
Semantics that matter.
- Averaging semantics per metric
- Weighting applied where needed
- Averages of averages prevented
Step 5: Show the Basis
With every answer.
- Completeness displayed
- Gap treatment stated
- Query available
Where It Works Well
- Operational questions over curated normalised metrics
- Estates where expected intervals are known per asset
- Users who will read a completeness figure when it matters
Where It Does Not Work Well
- Generation over raw time-series tables
- Aggregates returned without completeness
- Mixed unit sources with no central normalisation
Key Takeaway: Encode interval and unit semantics centrally, and report completeness alongside every aggregate.
Common Pitfalls
i) Averaging around gaps silently
A correct query over partial intervals answers a different question than the one asked. Compute and report completeness with every aggregate.
- Site comparisons are distorted by reporting differences
- Maintenance attention gets misdirected
- Query review cannot catch it because the query is fine
ii) Mixed unit aggregation
Sources reporting in different units summed without conversion produce confidently wrong totals. Normalise in the semantic layer.
iii) Averaging averages
Averaging pre-averaged site values weights a small site equally with a large one. Specify aggregation semantics per metric.
iv) Interpolation presented as measurement
Filled values indistinguishable from readings turn inference into apparent fact. Mark interpolation and state gap treatment.
Takeaway from these lessons: In time-series querying, completeness is part of the answer rather than metadata about it.
Text-to-SQL Best Practices for Energy: What High-Performing Teams Do Differently
1. Compute completeness with every aggregate
Report the proportion of expected intervals present, because an average over partial data describes an unstated period.
2. Normalise units in the semantic layer
Handle conversion once centrally rather than hoping each query gets it right across heterogeneous sources.
3. State gap treatment per metric
Say whether gaps are excluded, nulled, or interpolated, and mark interpolated values so inference is distinguishable.
4. Specify aggregation semantics
Prevent averages of averages and apply weighting where site or asset size matters.
5. Constrain generation to curated metrics
Give the generator a small safe space rather than a raw time-series schema to interpret.
Logiciel's value add is helping energy data teams encode interval, unit, and gap semantics so natural language querying over time-series data produces qualified rather than plausible answers.
Takeaway for High-Performing Teams: Compute completeness, normalise units, state gap treatment, specify aggregation, constrain generation.
Signals You Are Doing Text-to-SQL Well in Energy
How do you know it is working? Not by query accuracy, but by whether answers state their completeness. These are the signals that separate qualified answers from plausible ones.
Completeness is reported. Every aggregate states the proportion of expected intervals present.
Units are normalised. No query sums across unconverted sources.
Gap treatment is stated. Answers say what happened to missing readings.
Interpolation is marked. Inferred values are distinguishable from measured ones.
Aggregation is specified. Averages of averages do not occur.
Adjacent Capabilities and Connected Work
This work does not exist in isolation. Text to SQL depends on, and feeds into, the surrounding data platform. Ignoring the adjacencies is the most common scoping mistake.
Data products supply the completeness and gap contracts. Data quality SLAs formalise interval expectations. Master data management supplies asset identity and expected reporting frequency. Apache Iceberg or equivalent supplies reproducible history. Naming these adjacencies upfront keeps the work scoped and helps leadership see completeness as part of the answer.
The common mistake is treating each adjacency as someone else's problem. The interval expectations are your problem. The unit normalisation is your problem. The completeness reporting is your problem. Pretend otherwise and a site comparison distorted by reporting gaps will misdirect operational attention.
Own the adjacencies you depend on, partner with the teams that hold them, and share the semantics.
Conclusion
Natural language querying over energy time-series data fails differently from other domains. The dangerous output is not an error but a correct query that averaged the readings present and labelled the result with the period requested, silently describing eleven fewer days for one site than another.
Query review cannot catch that, because the query is fine and the gap is an absence. Encode expected interval frequency per asset and compute completeness alongside every aggregate. Normalise units centrally. State gap treatment per metric and mark interpolation.
Specify aggregation semantics so averages are weighted properly. Then display completeness with every number.
Key Takeaways:
- A correct query over incomplete intervals answers a different question than asked
- Completeness must be computed and reported with every aggregate, not on request
- Unit and interval mismatches across sources produce confidently wrong totals
Making text to SQL work requires time-series semantics. When done correctly, it produces:
- Answers that state the completeness of their period
- Comparisons that account for reporting differences
How an Energy Company Stopped Paying for Silent Data Quality Failures
Detect silent data quality failures faster and reduce operational risk.
- Inference distinguishable from measurement
- Routine operational questions answered without a queue
What Logiciel Does Here
If your averages silently exclude missing intervals, we help you encode interval expectations, normalise units, and report completeness with every answer.
Learn More Here:
- Data Products for Energy
- Data Quality SLAs for Energy
- Apache Iceberg for Energy
At Logiciel Solutions, we work with energy data leaders on analytics access. Our reference patterns come from time-series estates with routine gaps and mixed unit sources.
Book a technical deep-dive on making time-series querying report its own completeness.