Waste Exists but You May Not Be Able to See It
Data infrastructures work as designed. Everything runs smoothly. You have data pipeline processing. Dashboards are functioning. Artificial Intelligence ( AI ) systems are deployed. Yet the monthly cost for your cloud usage continues to climb.
In fact, the bill increases by some amount every month.
There is rarely an obvious failure to determine why costs keep increasing.
This is one of the challenges being faced across most modern systems:
The invisible growth in expenses.
Unlike outages, expense problems do not generate alerts.
They simply build to a point where they are a strategic issue.
If you are a Chief Technology Officer or Vice President of Engineering whose responsibilities include scaling data infrastructure, then cost optimisation has become an engineering responsibility.
This is due to inefficient systems:
Limiting growth and scalability
Reducing margins
Slowing down innovation
RAG & Vector Database Guide
Build the quiet infrastructure behind smarter, self-learning systems. A CTO’s guide to modern data engineering.
Within this guide, we will examine and provide insight into the following:
The true origins of infrastructure cost
Why so many teams have issues managing their expenses
How the best-in-class approach development of a cost-effective system without sacrificing performance
Let’s Look at the Basics.
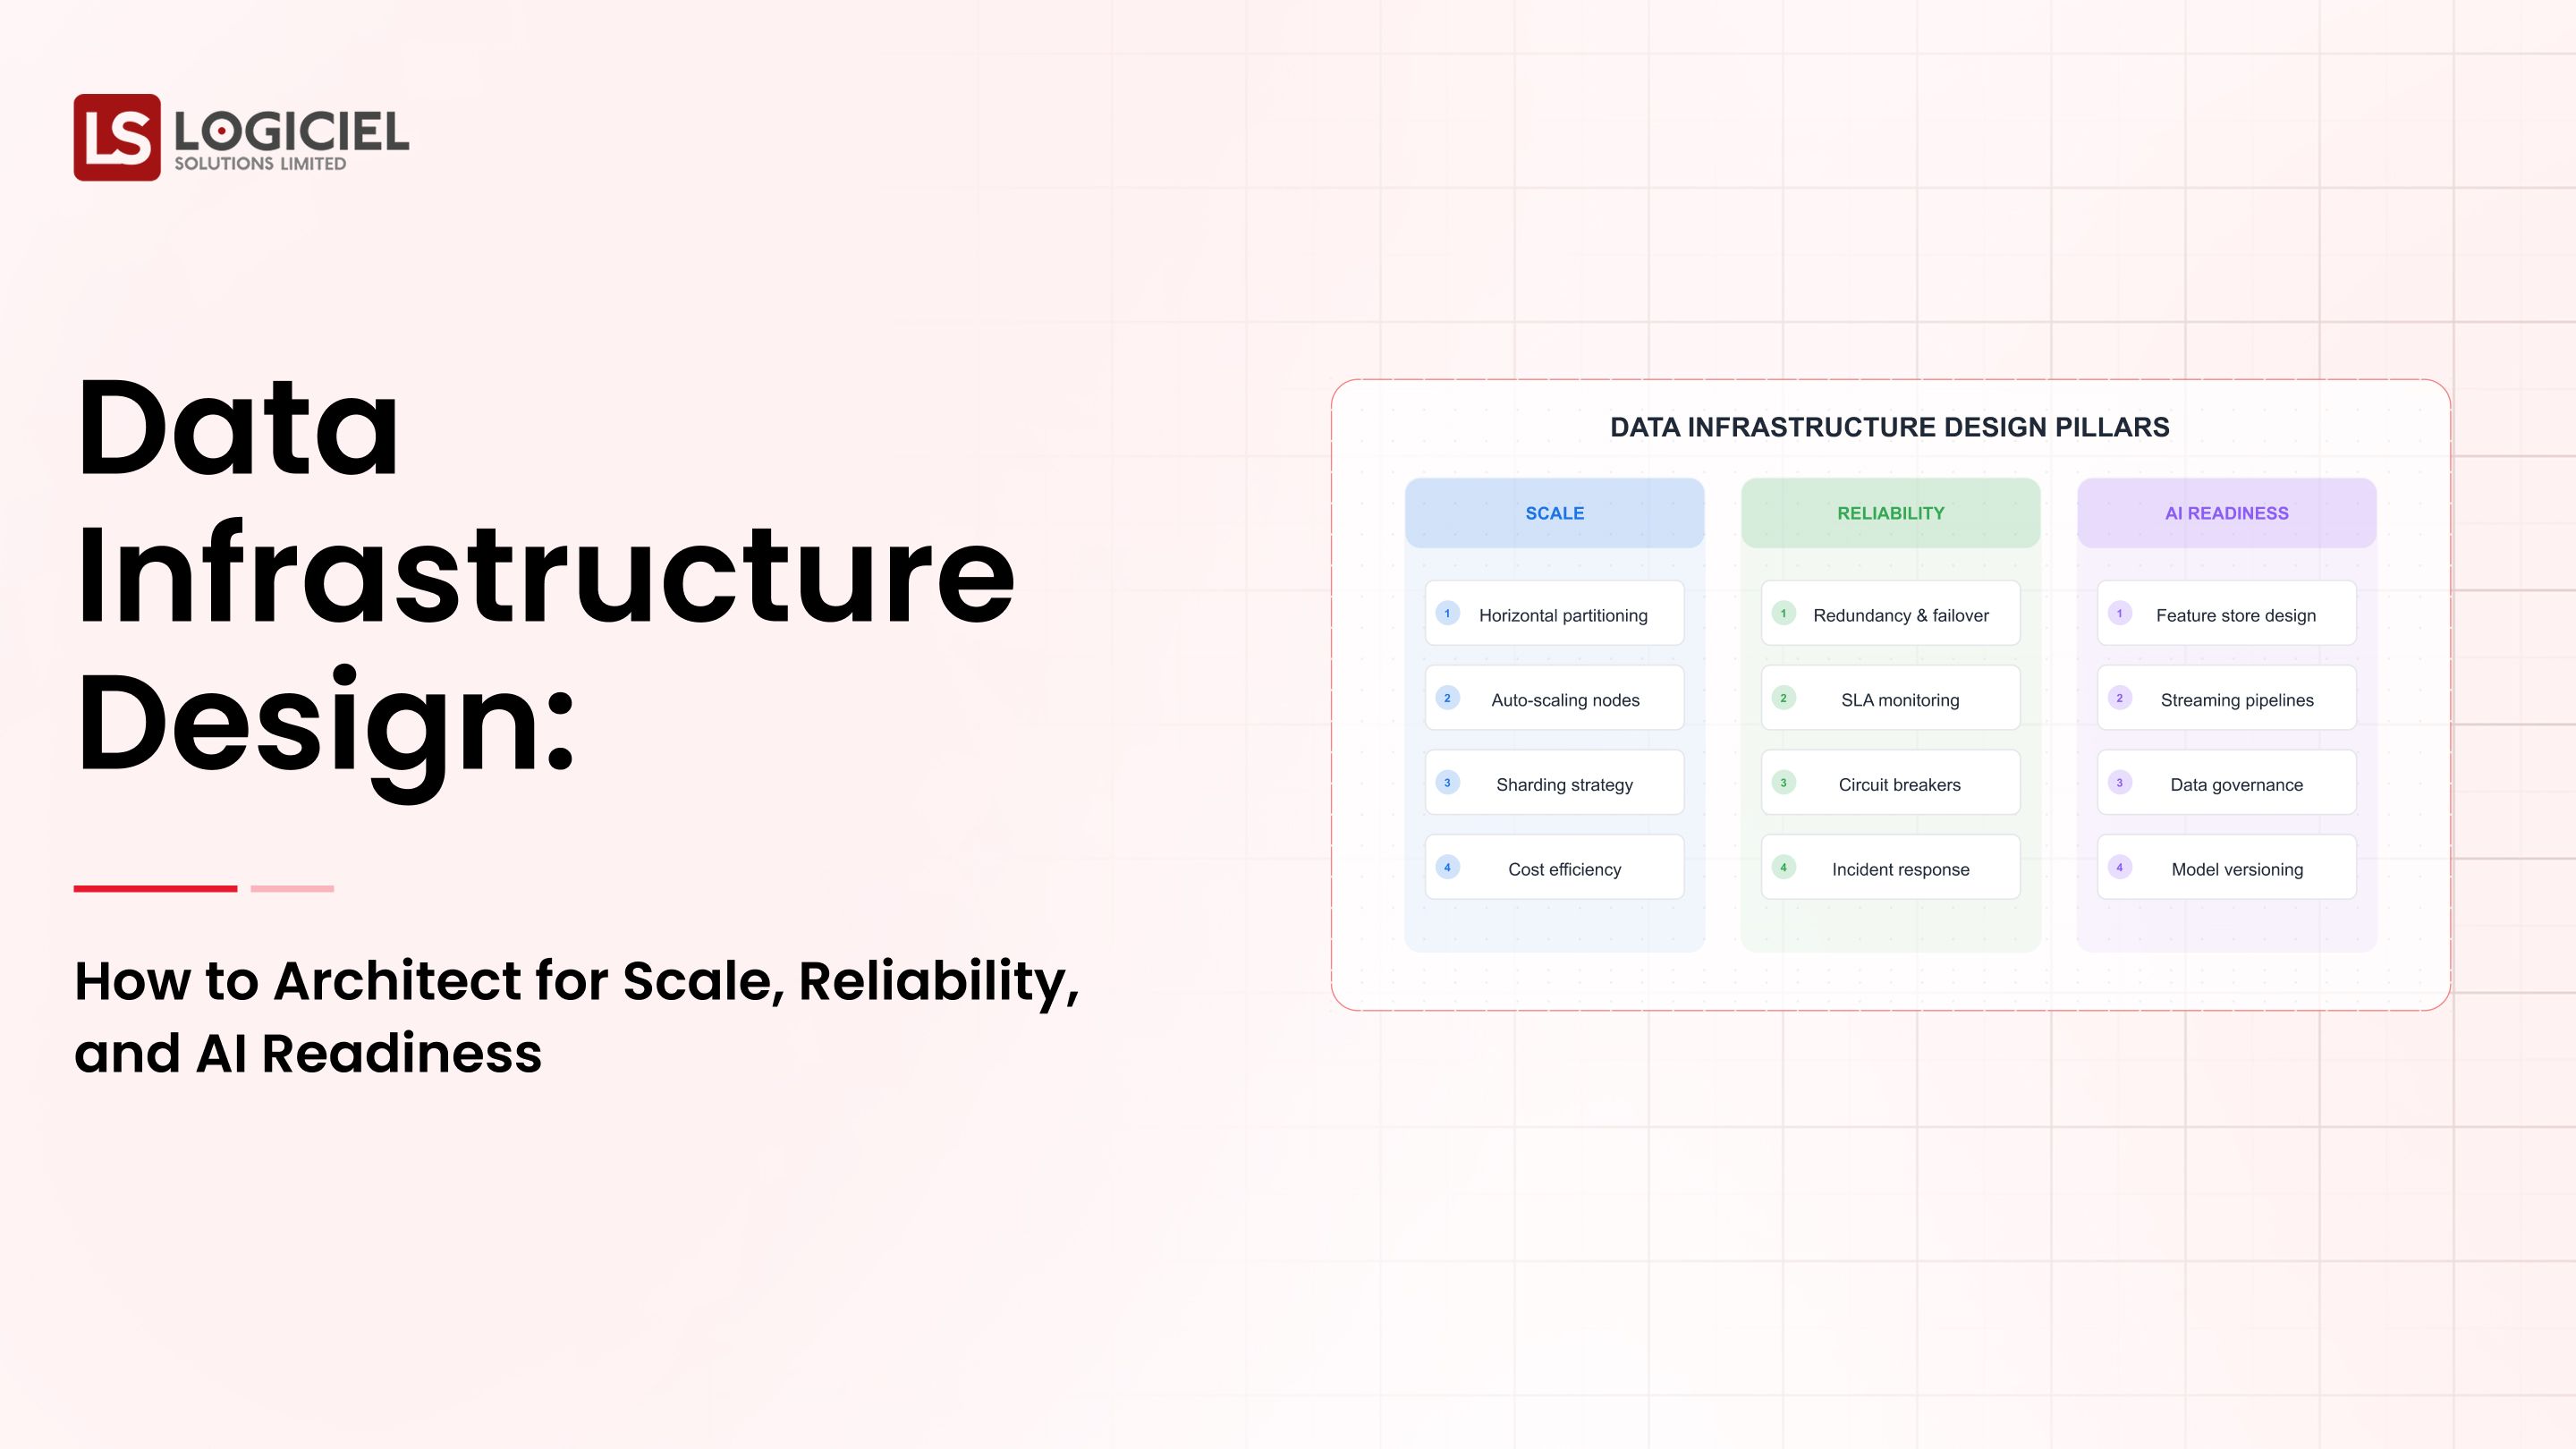
1st Section - Where Do Data Infrastructure Costs Come From
Most teams underestimate where their costs are originated.
1. Storage Costs
Includes:
- Raw data storage
- Processed data storage
- Back Ups
When measuring at scale, small inefficiencies can compound quickly.
2. Compute Costs
Include the following:
- Data Processing Jobs
- Query Execution Requests
- Transform/Modify Pipelines
The Compute Costs are usually the largest contributor to your total costs.
3. Data Movement Costs
As Data Is Moved Between:
- Systems
- Regions
- Services
All Have The Potential To CostResources and Idling Costs
All items mentioned above are seen as being ‘not used’, but they also incur costs associated with the resources themselves.
4. Tooling / Licensing
Using several tools increases the subscription to each tool and adds more cost to your operational overhead.
For example:
A pipeline that runs every hour will actually have an incremental number of records processed by each run.
There are also many more costs related to the amount of computing required to process those records than there are related to the number of times the pipeline runs.

Key Insight:
You will find that the vast majority of your cost is not related to the amount of scale, but rather a function of the inefficiencies from being at scale.
Section 2: Why Is Cost Optimization So Difficult With Today's Systems?
Costs are much harder to identify than performance issues.
1. Lack of Visibility
Most teams spend an enormous amount of time tracking their system's performance, but do not track their cost associated with the specific item.
2. Distributed Architecture
Modern systems can be distributed across numerous services, making it extremely difficult to track cost per service.
3. Misaligned Incentives
Teams are primarily focused on developing new features and creating reliable systems. As a result, costs tend to be an afterthought.
4. Rapid Growth
Cost associated with a rapidly growing system creates an increase in the total cost, and that makes it very difficult to find waste.
5. Over-Provisioning
Many teams provision more resources than they need in order to avoid performance issues.
Example:
When a system is designed to carry a maximum volume of traffic, it will operate at 100% capacity, even during non-peak hours.
Key Insight:
Cost inefficiencies are typically not intentional, but they are caused by not having the visibility to see how the overall system operates and by not having cost as a priority.
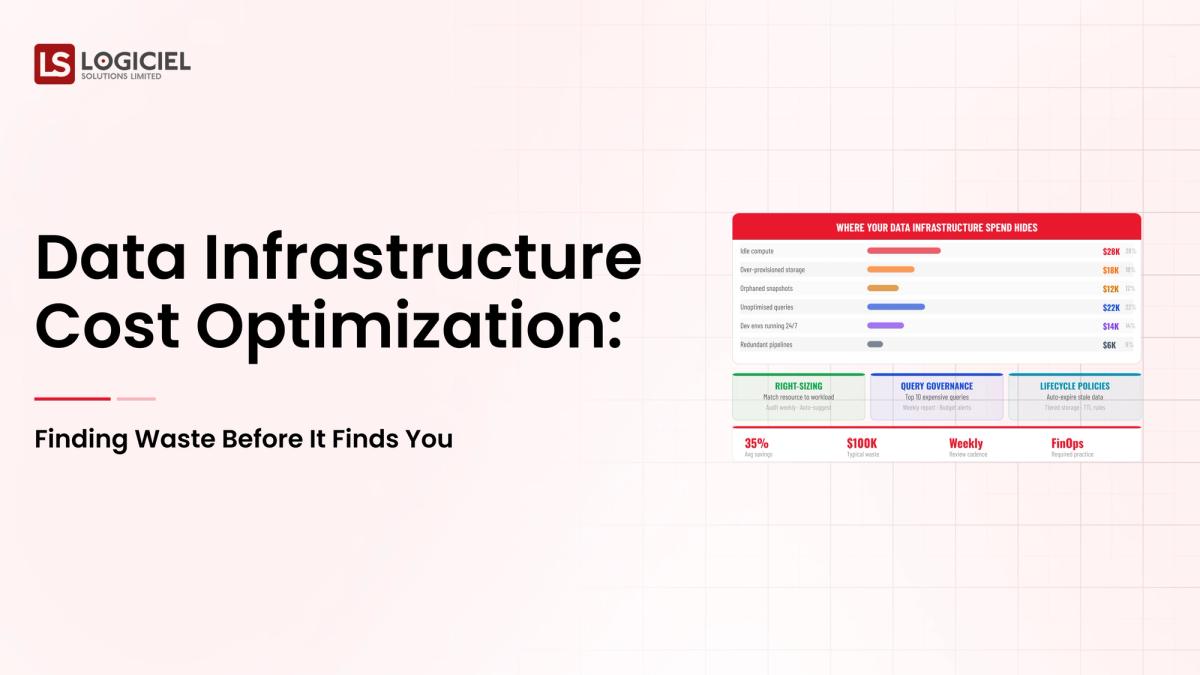
Section 3: Most Common Forms of Waste.
Understanding where your waste is occurring in order to work toward cost optimization.
Duplicate Data Storage
Inefficient Queries
Jobs Run Too Frequently
Unused Compute Resources
Tool Sprawl
Using several tools to accomplish the same function is common.Poor data lifecycle management results in the retention of vast amounts of unused or infrequently used data. Most organizations do not recognize this issue as it is hidden from view within the various problems related to inefficient processes throughout an organization's systems. With the right identification of the inefficiencies, organizations can serve to reduce unnecessary storage costs, supporting the overall efficiency of their data infrastructure.
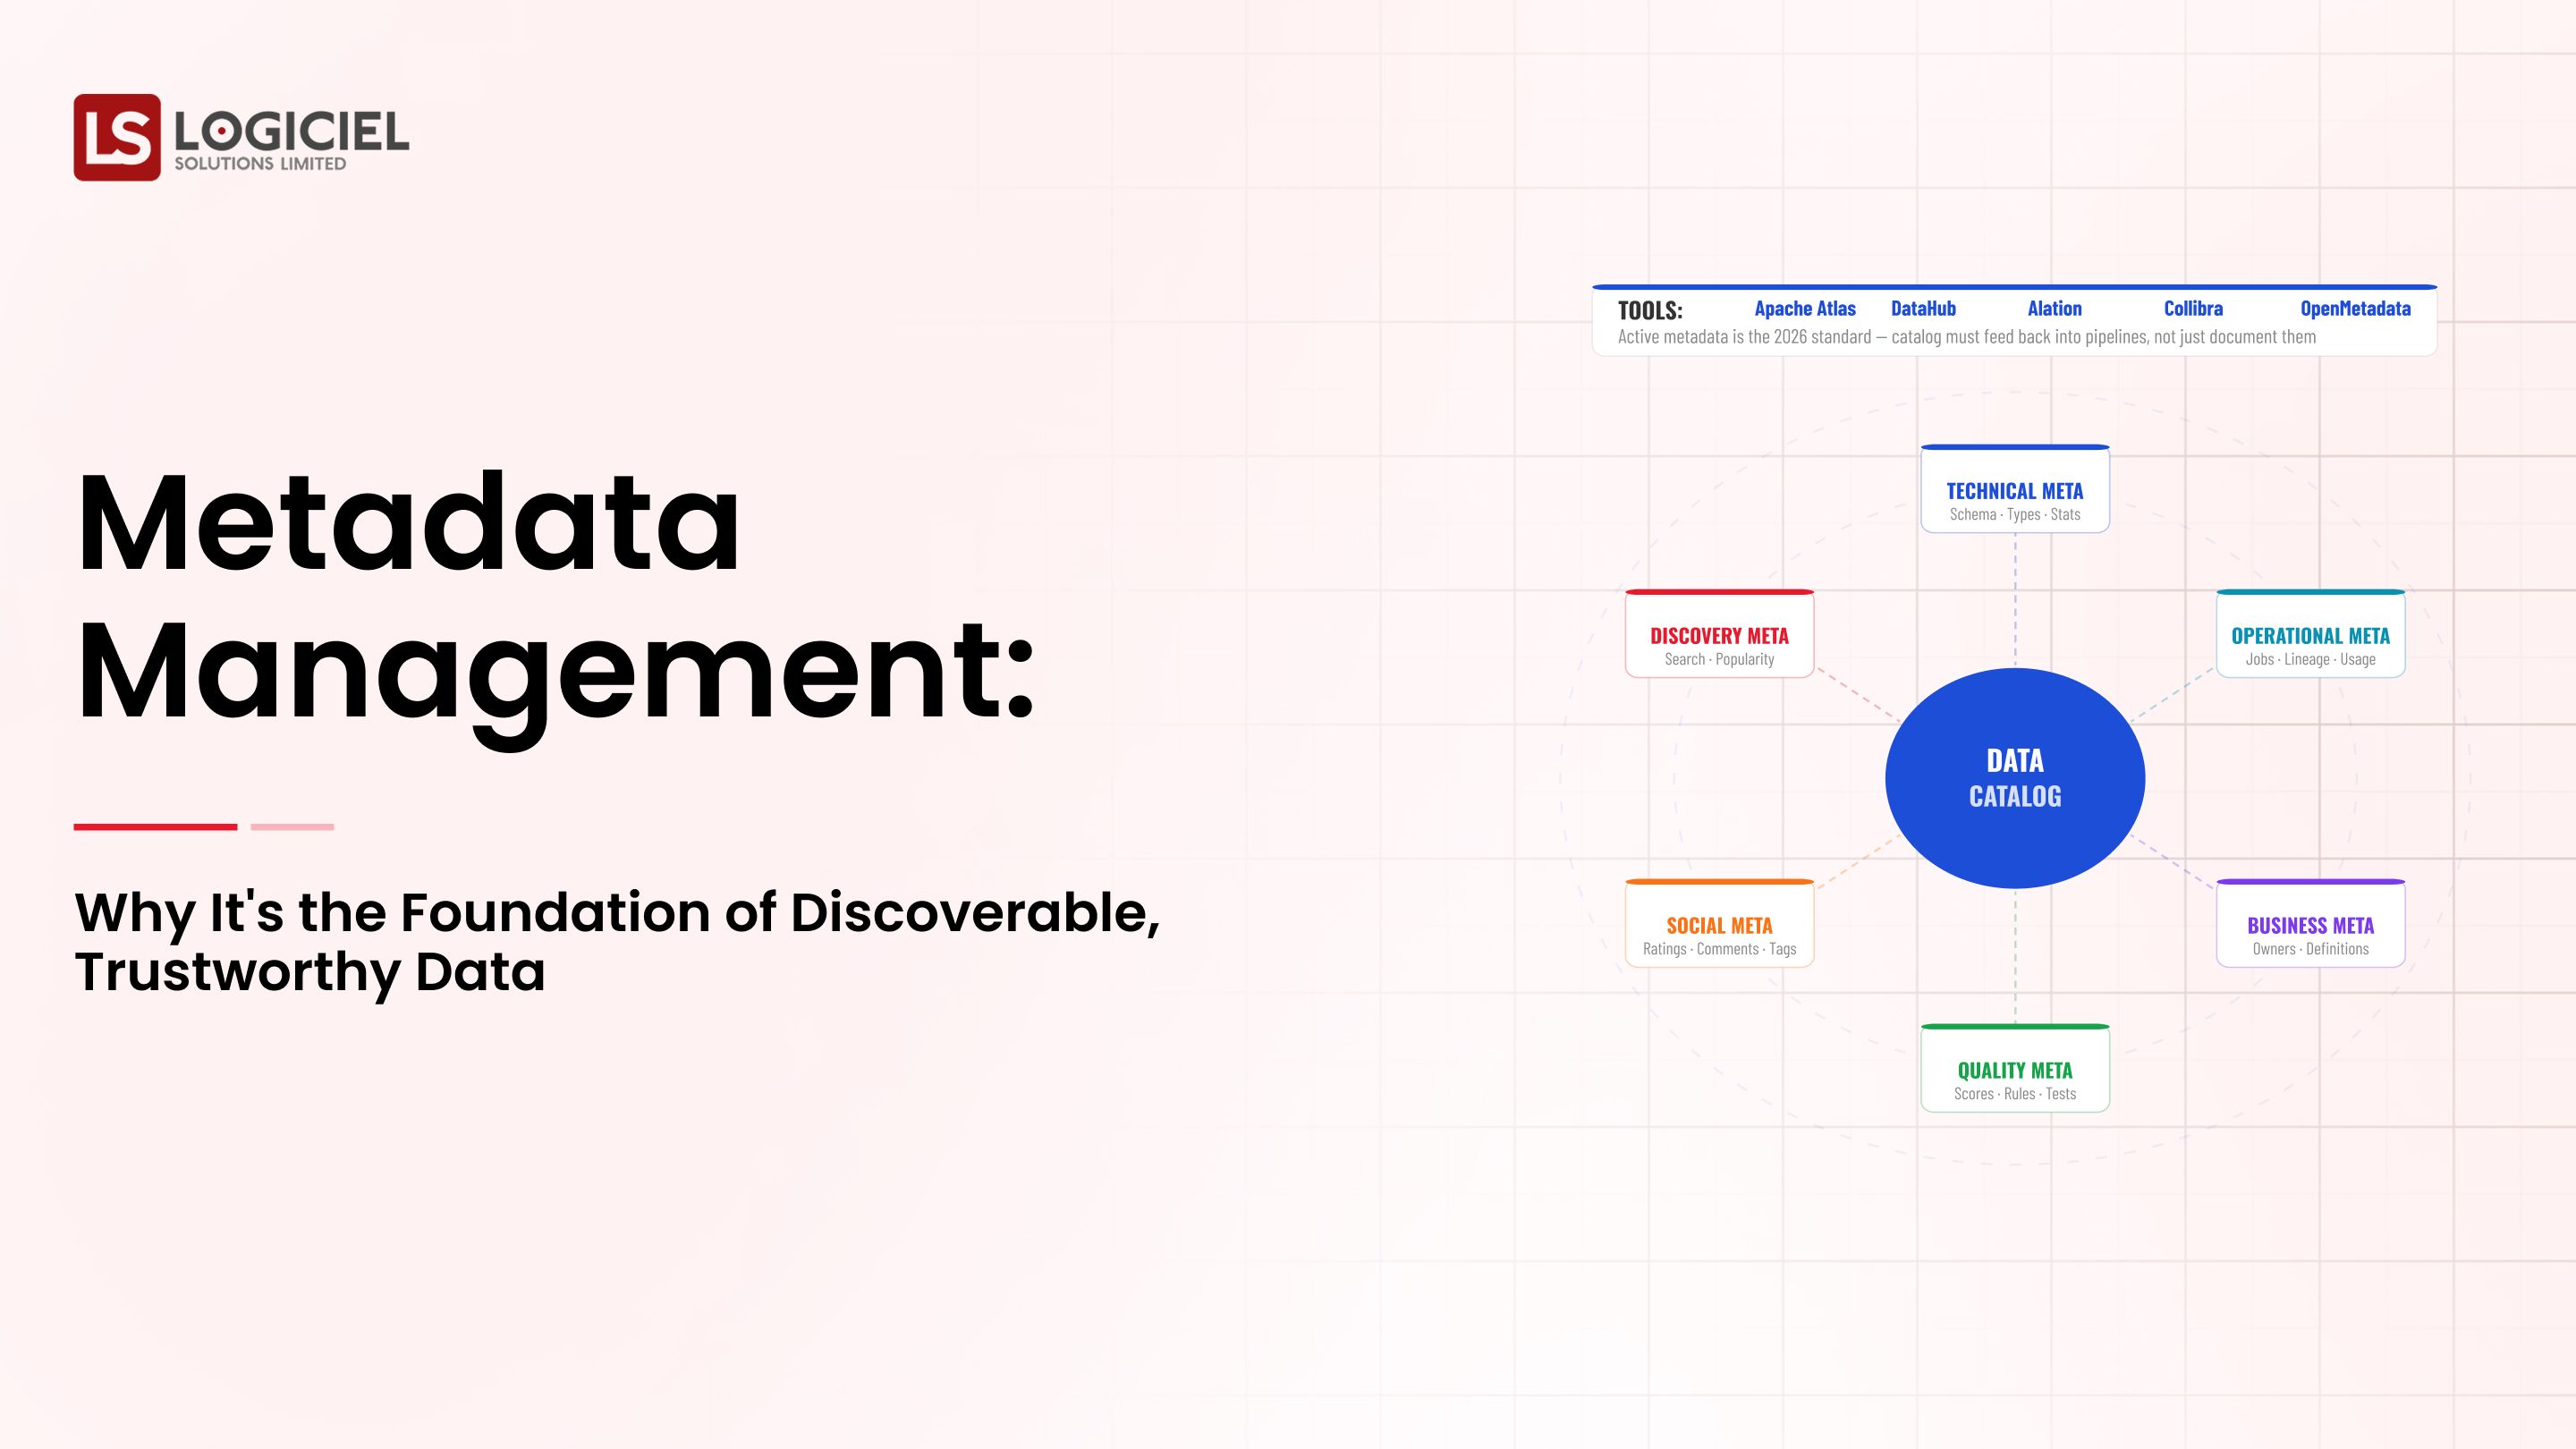
To identify inefficiencies in the data infrastructure, we have developed a number of established and effective techniques:
Visibility of the overall system operation plays a key role in how we see costs. Achieving a comprehensive view of costs can be accomplished by separating out the total cost into multiple layers.
- Analyze the individual components that make up the total cost structure (storage, compute, data movement, etc.).
- Define the data pipeline (the flow of data) for each dataset and relate it to its value, as well as to how you will be using the dataset over time.
- Identify the organization's cost per query.
- Identify the value of the pipeline that the organization has executed on that dataset.
- Monitor CPU and memory utilization for both utilization and non-utilized idle time for the entire organization.
- Identify low-value workloads by monitoring the number of times specific datasets are accessed and how often they were accessed.
- Establish dashboards that allow senior management and IT to view how much total costs were incurred, as well as view trends in costs, peaks, or irregularities in costs over time for the entire organization.
An example of one process would be:
- Analyze cost distribution.
- Identify areas of high cost (i.e., costing inefficiency)
- Establish criteria for analytics/data utilization to support optimization priorities.
- Establish optimization priorities.
After you have the ability to identify waste within an organization, it will allow for action to be taken against the waste.
Organizations should be working to optimize their storage through:
- Elimination of duplicate data
- Archiving of data that is no longer needed
- Reconciling data lifecycle policy
To increase querying efficiency through:
- Query optimization within SQL
- Elimination of unnecessary scans
- Use of indexes and partitioning to obtain efficient index access paths
To right size compute resources:
- Dynamically scale compute resources
- Eliminate over-provisioning of compute resources
To decrease the frequency at which data pipelines are run:
- Run data pipelines on an as-needed basis
- Eliminate execution of data pipelines
To decrease the number of tools within an organization:
- Standardize onto fewer standardized tool platformsAutomate Monitoring of Expense Establish Alerts for Unexpected Trends Continuously Monitor for Patterns
Example
Group:
Reduced Frequency of Pipelines Optimized Query Ques
Outcome:
Decrease in Overall Expenditures of 30-40%
Main Takeaway
Cost efficiency is not about conserving resources but using those resources efficiently.
Section 6: Preparing High Performance Teams for Future
Leading Teams Understand the Financial Value of Costs as a Measurement Device
1. Develop to Build Awareness of Cost
Engineers have a Clear Understanding of:
The Financial Impact of Their Decisions
2. Design Systems to Be Efficient
Systems are to Be:
Scalable Efficient in Resource Use
3, Create a Monitoring System for everything that is Billable
Cost is to Be:
Measured in Real Time Reviewed Regularly
4. Create a Correlation Between Cost and Value
Business will Compare Cost to Impact
5. Create Automate All Activity Related to Optimizing Costs
Auto-Scale and Alerts will be Used to Monitor Cost
6. Create an Architecture That is Simple to Use
Reduce Your Needs for:
Complexity Duplicated Processes
Example
High performance teams are proactive in identifying waste at the beginning of their activities and are continuously optimizing their processes so that cost variance is minimized while creating cost reference points that are consistent.
Main Takeaway
While designing a system has a low cost using this methodology will not happen overnight when high-performing teams are created they will put into place processes to have ongoing optimization.
Logiciel Perspective
Cost optimization is about being intelligent with your money as opposed to reducing your costs. Organizations that are successful at managing their budgets will;
Continue to Create Awareness of Cost Continue to Create Efficient Systems Continue To Create Ongoing Optimizations
Logiciel helps organizations build data infrastructures that are scalable and support the variety of performance, resiliency, and cost purposes.
If your data expenses are higher than your revenue, you should look to redesigning your systems.
For More Information on How Logiciel's AI-First Engineering Teams Create Scalable Data Infrastructures and Produce Efficient Systems with Zero Waste.
Agent-to-Agent Future Report
Understand how autonomous AI agents are reshaping engineering and DevOps workflows.
Frequently Asked Questions
What Does It Mean to Optimize Your Data Infrastructure Cost?
To Optimize Data Performance While Reducing Cost
What are the Primary Expenses Associated With Data?
Computing Costs, Storage Costs, Costs Related to Data Movement, and Costs Due to Inefficient Pipeline Operations
What Can I Do To Reduce My Costs While Maintaining My Performance?
Optimize Your Query, Right Size your Resources, and Eliminate Redundancies, Improve Design
How Often Should I Perform Cost Optimization?
Provide Ongoing Visibility into Performance By In-House Reviews at Periodic Intervals