There are three dashboards open in your next leadership meeting, and all three report a different revenue number for the same quarter. Finance trusts one, the revenue team trusts another, and the third is the one in the board deck. The next forty minutes are spent reconciling definitions instead of making a decision, and everyone leaves slightly less sure of the numbers than when they arrived.
This is more than a reporting inconsistency. It is a failure of the semantic layer.
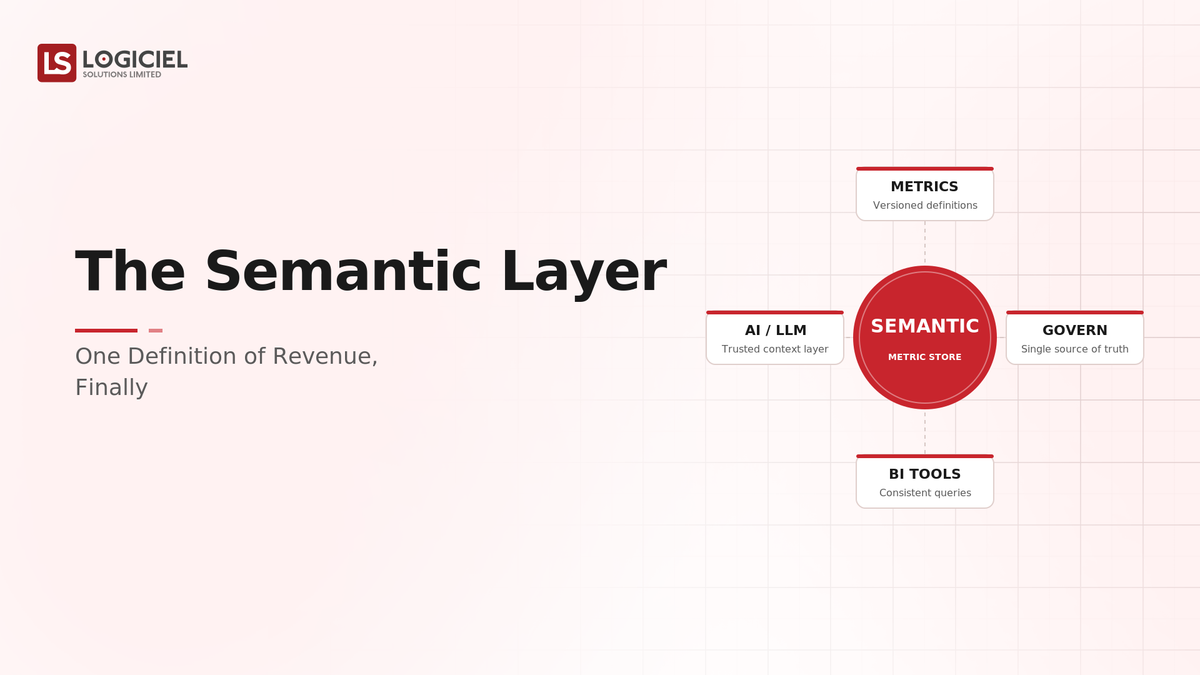
A semantic layer is more than a place to store SQL. It is a governed definition of an organization's metrics and dimensions, sitting between the warehouse and every tool that consumes data, so that "revenue" means one thing no matter who asks or which tool they ask from.
However, many teams let metric definitions live inside individual dashboards and notebooks, and discover the cost of that sprawl every time two numbers disagree in a room with executives in it.
If you are a Head of Data or analytics leader responsible for trusted metrics, the intent of this article is:
- Define what a semantic layer actually is
- Walk through how it produces one definition of every metric
- Lay out the governance and controls a production semantic layer needs
To do that, let's start with the basics.
Healthcare Organization Made Data AI-Ready Seamlessly
An AI-ready data playbook for Chief Data Officers who need ROI inside the existing stack.
What Is a Semantic Layer? The Basic Definition
At a high level, a semantic layer is a centralized, version-controlled definition of metrics and dimensions that every downstream tool queries through, so business logic lives in one place instead of being re-implemented in each dashboard.
To compare:
If raw warehouse tables are ingredients, the semantic layer is the agreed recipe. Without it, every cook makes "revenue" slightly differently; with it, the dish is the same regardless of who is in the kitchen.
Why Is a Semantic Layer Necessary?
Issues that a semantic layer addresses or resolves:
- Eliminating conflicting metric definitions across tools and teams
- Removing duplicated business logic scattered through dashboards
- Giving governance a single place to define and audit metrics
Resolved Issues by a Semantic Layer
- Produces one consistent value for each metric everywhere it appears
- Centralizes business logic so a change happens once, not in fifty places
- Makes metric definitions reviewable, versioned, and auditable
Core Components of a Semantic Layer
- Metric definitions with explicit formulas and grain
- Dimension and entity models that metrics are sliced by
- A query interface that downstream tools consume through
- Version control and review for every definition change
- Access controls and lineage from metric to source
Modern Semantic Layer Tools
- dbt Semantic Layer and MetricFlow for warehouse-native metrics
- Cube and AtScale for a dedicated semantic API across tools
- Looker's modeling layer for BI-centric metric governance
- Warehouse-native views and contracts where a full platform is overkill
- BI tools consuming metrics through the layer rather than redefining them
These tools reflect the shift from per-dashboard logic to a governed, centrally defined metric layer.
Other Core Issues They Will Solve
- Make every metric traceable from dashboard back to source
- Provide a single audit point for definition changes
- Allow new tools to adopt existing metrics without re-implementation
In Summary: A semantic layer turns scattered, conflicting metric logic into one governed definition that every tool shares.
Importance of a Semantic Layer in 2026
The semantic layer has moved from a nice-to-have to a requirement as the analytics stack has fragmented. Four reasons explain why it matters now.
1. The tool sprawl is real.
Organizations run several BI tools, notebooks, and AI assistants against the same warehouse. Without a shared layer, each one invents its own metric logic.
2. AI now queries your metrics.
When an LLM answers "what was revenue last quarter," it needs a governed definition to query, not a guess assembled from raw tables. The semantic layer is how AI gets trustworthy numbers.
3. Trust in data is a measurable cost.
Every reconciliation meeting and every "which number is right" thread is time spent because definitions diverged. That cost is now visible to leadership.
4. Governance expects a single source of definition.
Auditors and finance want to see where a metric is defined and how it changed. Scattered logic across dashboards cannot answer that.
Traditional vs. Modern Metric Definition
- Logic embedded in each dashboard vs. defined once in a shared layer
- Conflicting numbers reconciled in meetings vs. one consistent value everywhere
- Untracked changes vs. version-controlled, reviewed definitions
- BI-only vs. one layer serving BI, notebooks, and AI alike
In summary: Modern metric definition is centralized, governed, and consumed by every tool through one layer.
Details About the Core Components of a Semantic Layer: What Are You Designing?
Let's go through each layer.
1. Metric Definition Layer
Where each metric's formula and grain are declared once.
Metric decisions:
- Explicit formula, grain, and filters per metric
- Ownership assigned for each metric definition
- Deprecation path for retired or renamed metrics
2. Entity and Dimension Layer
The dimensions and entities metrics are sliced by.
Modeling decisions:
- Consistent entity keys across metrics
- Shared dimensions so slices align across metrics
- Documented relationships between entities
3. Query Interface Layer
How downstream tools consume metrics.
Interface decisions:
- Tools query metrics, not raw tables
- A stable API or interface contract for consumers
- Caching strategy for common queries
4. Governance Layer
How definitions are changed safely.
Governance decisions:
- Version control and peer review for every change
- Change log visible to consumers
- Tests that catch a definition change altering a number unexpectedly
5. Lineage and Access Layer
How metrics trace to source and who can see what.
Lineage decisions:
- Lineage from metric to underlying tables
- Row- and column-level access enforced at the layer
- Audit of who queried which metric
Benefits Gained from Centralized Definition and Governance
- One trusted value for each metric across every tool and audience
- Changes made once, reviewed, and propagated everywhere automatically
- A defensible audit trail of how each metric is defined and has changed
How It All Works Together
A metric is defined once, with its formula, grain, and owner, in the semantic layer and committed to version control. Downstream tools, BI dashboards, notebooks, and AI assistants, query that metric through the layer's interface rather than writing their own SQL. The governance layer reviews every definition change and logs it. Lineage ties each metric back to its source tables, and access controls enforce who can see what. When revenue needs to change, it changes in one place, is reviewed, and every dashboard reflects the new definition without anyone editing a dashboard.
Common Misconception
A semantic layer is just a set of saved SQL views.
A semantic layer is a governed system of metric definitions, dimensions, a query interface, version control, lineage, and access. Saved views are a fragment of it; the governance and the shared consumption are what make numbers agree.
Key Takeaway: The value is not storing the SQL, it is that every tool and every person queries the same governed definition.
Real-World Semantic Layer Implementation in Action
Let's take a look at how a semantic layer operates with a real-world example.
We worked with a company whose revenue number differed across finance, product, and the board deck, with these constraints:
- Produce one definition of revenue every tool would honor
- Make definition changes reviewable and auditable
- Let the existing BI tools adopt the metrics without a rebuild
Step 1: Inventory the Conflicting Definitions
Find every place revenue is currently defined and document how each differs.
- Catalog of dashboards and queries defining the metric
- The specific differences between definitions
- The owner who will arbitrate the canonical version
Step 2: Define the Canonical Metric Once
Agree the formula, grain, and filters and declare them in the semantic layer.
- Single declared definition with explicit grain
- Named owner for the metric
- Committed to version control with review
Step 3: Point Tools at the Layer
Migrate dashboards and notebooks to query the metric through the layer.
- BI tools consuming the defined metric
- Raw-table queries for the metric retired
- Lineage from metric to source captured
Step 4: Govern Changes
Put every future definition change through review and logging.
- Peer review on definition changes
- Change log visible to consumers
- Tests catching unexpected value shifts
Step 5: Extend to AI and New Tools
Let AI assistants and new tools adopt the same definitions.
- AI queries metrics through the layer
- New tools inherit existing definitions
- Access controls enforced centrally
Where It Works Well
- A single declared definition per metric, owned and version-controlled
- All tools querying through the layer rather than raw tables
- Governed changes with lineage and a visible change log
Where It Does Not Work Well
- Metric logic still duplicated inside individual dashboards
- A layer that exists but that tools bypass with raw SQL
- Definition changes made without review, so numbers shift silently
Key Takeaway: The semantic layer that ends the revenue argument is the one every tool actually queries through, with governance on every change, not the one that exists but gets bypassed.
Common Pitfalls
i) Building the layer but letting tools bypass it
A semantic layer that teams route around with raw SQL solves nothing. Adoption is the point; make querying through the layer the path of least resistance.
- Migrate existing dashboards onto the layer
- Make raw-table metric queries the exception
- Monitor for bypass
ii) No metric ownership
A metric without an owner has no one to arbitrate its definition, so it drifts. Assign ownership for every metric.
iii) Ungoverned changes
A definition changed without review silently moves numbers across every dashboard. Review and log every change.
iv) Modeling everything at once
Trying to define every metric before launching delays value indefinitely. Start with the contested metrics that cause the most pain.
Takeaway from these lessons: Most semantic-layer failures trace to adoption and governance gaps, not modeling. Make the layer the default path and govern every change.
Semantic Layer Best Practices: What High-Performing Teams Do Differently
1. Start with the metrics that cause arguments
Define the contested metrics, revenue first, before modeling everything. Solve the visible pain and build credibility.
2. Assign an owner to every metric
Ownership is what keeps a definition from drifting. Every metric has a name attached.
3. Make the layer the default path
Migrate tools onto it and make raw-table metric queries the exception, not the norm. A bypassed layer is wasted effort.
4. Govern changes like code
Version control, peer review, change logs, and tests that catch a definition change moving a number unexpectedly.
5. Serve AI from the same definitions
Let AI assistants query metrics through the layer so their answers match the dashboards. One definition for humans and machines alike.
Logiciel's value add is helping teams inventory conflicting definitions, declare canonical metrics, and stand up the governance and lineage that keep the layer authoritative, so the organization gets one trusted number rather than another tool nobody uses.
Takeaway for High-Performing Teams: Focus on adoption and governance. A semantic layer that tools bypass is a modeling exercise; one they all query through is a source of truth.
Signals You Are Designing the Semantic Layer Correctly
How do you know the semantic-layer program is set up to succeed? Not in the existence of the layer, but in the daily evidence the organization produces. Below are the signals that distinguish programs on the path from programs that look like progress.
The revenue argument has stopped. Teams cite the same number because they query the same definition, and the reconciliation meetings have quietly disappeared.
Every metric has an owner. The team can name who owns revenue, and who would review a change to it.
Changes are reviewed and logged. The team can show the last definition change, who approved it, and what it affected.
Tools query through the layer. The team can show that dashboards consume defined metrics, not bespoke SQL, and can spot a bypass.
AI answers match the dashboards. When an assistant reports a metric, it matches the BI number because both came from the same layer.
Adjacent Capabilities and Connected Work
This work does not exist in isolation. The semantic layer depends on, and feeds into, several adjacent capabilities. Building one without thinking about the others is the most common scoping mistake.
In most enterprise programs, the semantic layer shares infrastructure with the data warehouse, the BI stack, and the data governance process. It shares team capacity with analytics engineering, data platform, and the analysts who consume metrics. And it shares leadership attention with whatever the next data or AI initiative is on the roadmap. Naming these adjacencies upfront helps the program scope realistically and helps leadership see the work as a portfolio rather than a one-off project.
The most common mistake in adjacent-capability scoping is treating each adjacency as someone else's problem. The warehouse modeling underneath the metrics is your problem. The BI migration onto the layer is your problem. The governance process that reviews definition changes is your problem. Pretending otherwise pushes work to teams that did not plan for it, and the work returns to you later as a bypassed layer or a silent number change. Own the adjacencies you depend on; partner with the teams that own them; share the timeline.
Conclusion
A semantic layer ends the argument about whose number is right by making sure there is only one number. The discipline that turns scattered metric logic into a source of truth is the same discipline that matures any shared asset: define once, govern changes, and drive adoption.
Key Takeaways:
- A semantic layer is a governed system, not a pile of saved SQL
- Define each metric once, with an owner, and govern every change
- The value comes from adoption: every tool must query through the layer
Building an effective semantic layer requires definition, governance, and adoption discipline. When done correctly, it produces:
- One trusted value for each metric across every tool and audience
- Changes made once and propagated everywhere automatically
- AI answers that match the dashboards
- A defensible audit trail of how each metric is defined
VP of Data Secured Modern Platform Funding
A funding playbook for VPs of Data who need a board to approve the next platform.
What Logiciel Does Here
If you are tired of reconciling revenue numbers, inventory the conflicting definitions, declare the canonical metric once, and make every tool query through the layer.
Learn More Here:
- Building a Data Catalog People Actually Use
- Data Governance and Cataloging Services
- Data Contracts in Practice: How Teams Actually Ship Them
At Logiciel Solutions, we work with Heads of Data on semantic-layer design, metric governance, and BI migration. Our reference patterns come from production analytics platforms.
Explore how to build your organization's semantic layer.
Frequently Asked Questions
What is a semantic layer?
A centralized, version-controlled definition of an organization's metrics and dimensions that sits between the warehouse and every consuming tool, so business logic is defined once and every tool returns the same value for a metric.
How is a semantic layer different from saved SQL views?
Views store query logic but do not provide governance, ownership, lineage, a shared query interface, or consistent adoption across tools. A semantic layer adds the governance and shared consumption that make numbers actually agree.
Why do different tools report different revenue numbers?
Because each dashboard or notebook re-implements the metric logic with slightly different filters, grain, or joins. A semantic layer removes this by defining the metric once and having every tool query through it.
How does a semantic layer help with AI?
It gives AI assistants a governed definition to query, so when an LLM answers a question about a metric, it returns the same value as the dashboards rather than assembling a guess from raw tables.
What is the biggest mistake when adopting a semantic layer?
Building the layer but letting tools bypass it with raw SQL. Without adoption, conflicting definitions persist and the layer adds no value. Make querying through the layer the default path and govern every change.