The CFO meeting on the calendar
Your monthly finance review is Thursday at 2pm. Last quarter the AI cost line was the biggest single overage on the engineering budget. The CFO has asked for it as a standing agenda item. The folder labeled "AI Cost" on the company shared drive has three slides in it, none recent.
You have until Thursday.
This is the framing problem most AI cost content gets wrong. CFOs don't want a strategy. They don't want a framework. They want one number, refreshed daily, accountable to one person, with a forecast that holds up under sensitivity. The CFO meeting is short. The number needs to be ready.
ROI of AI-Ready Data Infrastructure
Inside an 8-month rebuild that turned three failed pilots into a 9:1 ROI model.
The economics that triggered this conversation
Enterprise generative AI spending hit $37 billion in 2025, up 3.2x from $11.5 billion in 2024. Inference spending alone is projected to hit $20.6 billion in 2026, capturing 55% of all AI cloud infrastructure spend. The per-token cost collapsed (by some measures 280-fold), but the workloads grew faster.
The result the CFO is reading: AI cost is the single fastest-growing line in most engineering budgets. The result the CTO is feeling: nobody on the team can answer "what did we spend yesterday on AI" with specificity. The result the CFO is responding to: budget conversations have moved from quarterly to weekly.
The unit-economics question that actually matters
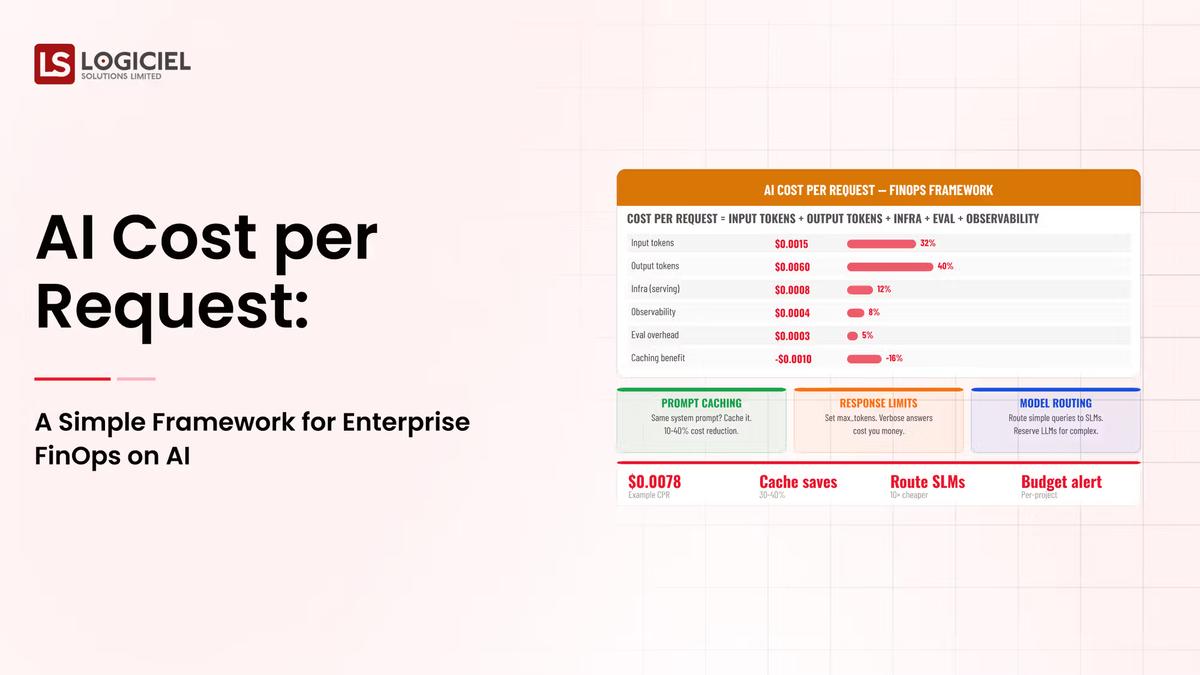
The CFO doesn't want to hear about token economics. They want to hear about per-request cost, per-feature cost, and per-customer cost. Those are the numbers that map to financial planning.
A working FinOps framework for AI produces three answers in real time:
What did each AI feature cost yesterday, broken out by feature, tenant, and team? This is the operational answer. The dashboard refreshes daily. Engineering sees it in their morning routine.
What's the per-request cost trend over the last 90 days, by feature? This is the trajectory answer. It tells you whether you're improving, drifting, or holding.
What's the forecast for next quarter at half, expected, and double current usage? This is the planning answer. The CFO uses it for budget decisions.
The CTO who walks into Thursday's meeting with those three answers has a different meeting than the CTO who walks in with a slide deck.
The five-layer framework
A working AI FinOps practice has five operational layers. Most enterprises have one or two. The high performers have all five.
Layer 1: Per-request cost capture
Every AI inference call gets tagged with feature, tenant, team, and request type at the gateway level. The cost gets attributed to the right business unit at the moment of capture, not reconstructed from logs later.
This is the foundation. Without it, every other layer is operating on guesswork. The build effort is a 1-2 week engineering investment if you have a gateway already, longer if you don't. Either way it's the first investment.
Layer 2: Daily dashboard
The captured cost feeds a dashboard refreshed daily. The dashboard shows the same numbers in three views: by feature, by tenant, by team. There's an anomaly indicator. There's a trend.
The dashboard is owned by a named person in engineering. Not in finance. The named owner's job is to argue against cost drift. That role didn't exist on most engineering teams 18 months ago. It exists now on the teams the CFO trusts.
Layer 3: Per-request cost optimization tracking
When you implement prompt caching, tier routing, or retrieval tuning, the dashboard tracks the impact. Anthropic's caching delivers up to 90% savings on cached prompts. Bedrock similar. OpenAI's automatic caching produces around 50% on cached calls. Each optimization shows up as a measurable inflection on the trend line.
Programs without this tracking deploy optimizations and never know if they worked. Programs with it can defend the optimization investment to the CFO with specific numbers.
Layer 4: Multi-scenario forecast
The forecast runs three scenarios: half current usage, current usage, double current usage. Each scenario gets a cost projection over 90 days and 12 months. The forecast updates as the dashboard data accumulates.
This is the layer that gives the CFO confidence in your budget. CFOs don't need point estimates; they need bounds. The three-scenario forecast bounds the answer.
Layer 5: Weekly operating cadence
The cost dashboard gets reviewed weekly. Not by finance. By engineering, with finance present. The review takes 30 minutes. The output is decisions: which optimization to ship next, which feature has the worst unit economics, which usage pattern is driving the variance.
Programs without the cadence let cost drift compound. Programs with it catch drift in the same week it starts.

What the cadence produces over time
Six months of weekly cadence on the framework above produces specific outcomes the CFO can take to the board.
Cost per request, broken out by feature, with a measurable downward trend. Not because the workload shrunk; because optimizations are landing.
Per-feature unit economics that map directly to the revenue or efficiency the feature produces. Features that lose money get sunset. Features that produce value get more investment.
A forecast that holds up under quarterly review. The CFO's confidence in the engineering team's cost discipline becomes a positive signal in board reports. Engineering's relationship with finance becomes collaborative.
Defensible answers to the questions the CFO is now asking weekly.
What stops most programs from doing this
Three patterns. Worth naming.
The cost dashboard doesn't get built because nobody made it someone's specific job. The cost line on the cloud bill exists; the per-feature breakdown doesn't. Six months later, the CFO is asking for it under pressure and the team is reconstructing from logs.
The dashboard exists but doesn't have a named owner. The dashboard refreshes weekly but nobody reviews it. Variances accumulate. The owner role is the multiplier.
The cadence isn't protected. The weekly review gets canceled for higher-priority meetings. After three months of skipped reviews, the program is operating without the discipline that produces the outcomes the CFO wanted in the first place.
How Logiciel fits this conversation
Most CTOs who reach out to us about AI FinOps are 30-60 days from a difficult quarterly review or already in the middle of one. The cost line is the problem. The visibility isn't there. The team is busy on feature work.
The work we do is the five-layer framework: per-request capture, daily dashboard, optimization tracking, multi-scenario forecast, and weekly cadence. We pair with your senior engineer to build it, and we leave the named cost owner role with your team so the discipline continues after we're gone.
Typical engagement outcome: cost visibility within 2-4 weeks, measurable cost reduction within 8-12 weeks, defensible CFO posture within one quarter.
Scaling Data Team Without Scaling Headcount
Inside a 12-week overhaul that doubled output and cancelled two senior data engineering hires.
Call to Action
The 30-minute move
Book a working session with a senior Logiciel engineer. Bring last quarter's AI cost numbers if you can pull them. We'll walk through the five layers, name the layer most likely to have the highest leverage on your specific situation, and tell you the work that produces the first usable dashboard.
Book the 30-minute FinOps session →
For the longer read, the AI Velocity Blueprint includes our cost optimization checklist alongside the broader AI engineering scorecard.
Download the AI Velocity Blueprint →
Frequently Asked Questions
Our AI spend is small. Is this premature?
Probably not. Most enterprise AI spend grows 3-5x in the second year as features ship on the same platform. Building cost discipline before the growth costs an order of magnitude less than building it after the CFO is angry.
Doesn't our cloud provider's billing tool give us this?
Partially. Cloud billing tools give you cost by service. The framework gives you cost by your feature, your tenant, your team, your business outcome. The gap is real and important to the CFO.
Who should own the cost dashboard?
Engineering, with finance present at the weekly review. The named owner is an engineer whose role partly exists to argue against cost drift. The role didn't exist on most teams 18 months ago. It exists now on the teams the CFO trusts.
How granular should per-request capture be?
Feature, tenant, team, request type at minimum. Add user-level only if you have a reason. Privacy and PII considerations dominate this choice; most enterprises don't need user-level granularity.
What's the highest-leverage layer to build first?
Per-request cost capture. Every other layer compounds on it. Without it, every other layer is operating on guesswork. Build the capture; the dashboard, optimization tracking, forecast, and cadence follow naturally. --- Sources cited: - Enterprise GenAI spend: $37B in 2025, 3.2x YoY - Inference cost collapse 280-fold - Prompt caching: Anthropic 90% / Bedrock 90% / OpenAI 50%