Your Data Framework is functioning properly and pipelines are "running," yet still stakeholders have little to no trust in your data. They second guess their decision-making process by manually reconciling your data and constantly have questions about the veracity of your data outputs.
This situation is indicative of hidden inefficiencies in managing your Data Framework.
Most teams track metrics associated with action; however, few track those associated with result.
If you are a VP or Head of Data, this guide will provide you with information necessary to accomplish:
- Understand that measuring your Data Frame work is not as easy as it sounds
- Identify the key metrics associated with the reliability level of your data (and business results)
- Creating a measurement system that ensures continual improvement in your framework
Because, if you are not accurately measuring what you are doing then, you are optimizing the wrong framework.
From Data Chaos to Data Confidence
Inside a 6-month plan that turned 47 fragile pipelines into 98.7% reliability.
Why Is It Hard To Measure Data Frameworks
At first glance, measuring a data structure is easy. To do this you would:
Track:
- Number of executed pipelines
- Number of processed queries
- Number of completed jobs
However these measurements do not give you what you require to measure effectively; rather the measurements that you require for an effective measurement system are as follows:
OUTPUTS:
- Execution count (pipelines that were executed)
- Volume of processed data
OUTCOMES:
- Were decisions executed in a more efficient manner?
- Is there a greater level of trust towards data accuracy?
- Has there been a decrease in data related incidents?
How Did This Discrepancy Develop
Technical/Infrastructure Related Metrics Don't Translate To Business Impact
Technical related metrics do not typically have a direct relationship with business impact!
Numerous Interests Lead to Diverse Queries
Chief Technology Officer:
Focused on system reliability and flexibility as key metrics.
Chief Financial Officer:
Concerned with how efficient a system is at achieving financial goals/metrics.
Business Areas:
Interest in having accurate information and how fast they can get it.
Not Having an All-Encompassing Measurement of Performance
Metrics located in disparate locations therefore little chance of being able to analyze as a complete entity.
Outcomes of Not Having a Unified Measurement of Performance:
a. Organizations optimize their procedures based on productivity rather than value.
b. Executives do not have visible insight into their organization's level of performance.
c. Difficulty in making investment decisions in a Search for Information.
Essential Insight
Measuring the Infrastructure Management of Data is not so much about increasing the number of metrics you generate; it is primarily about using the correct metrics.
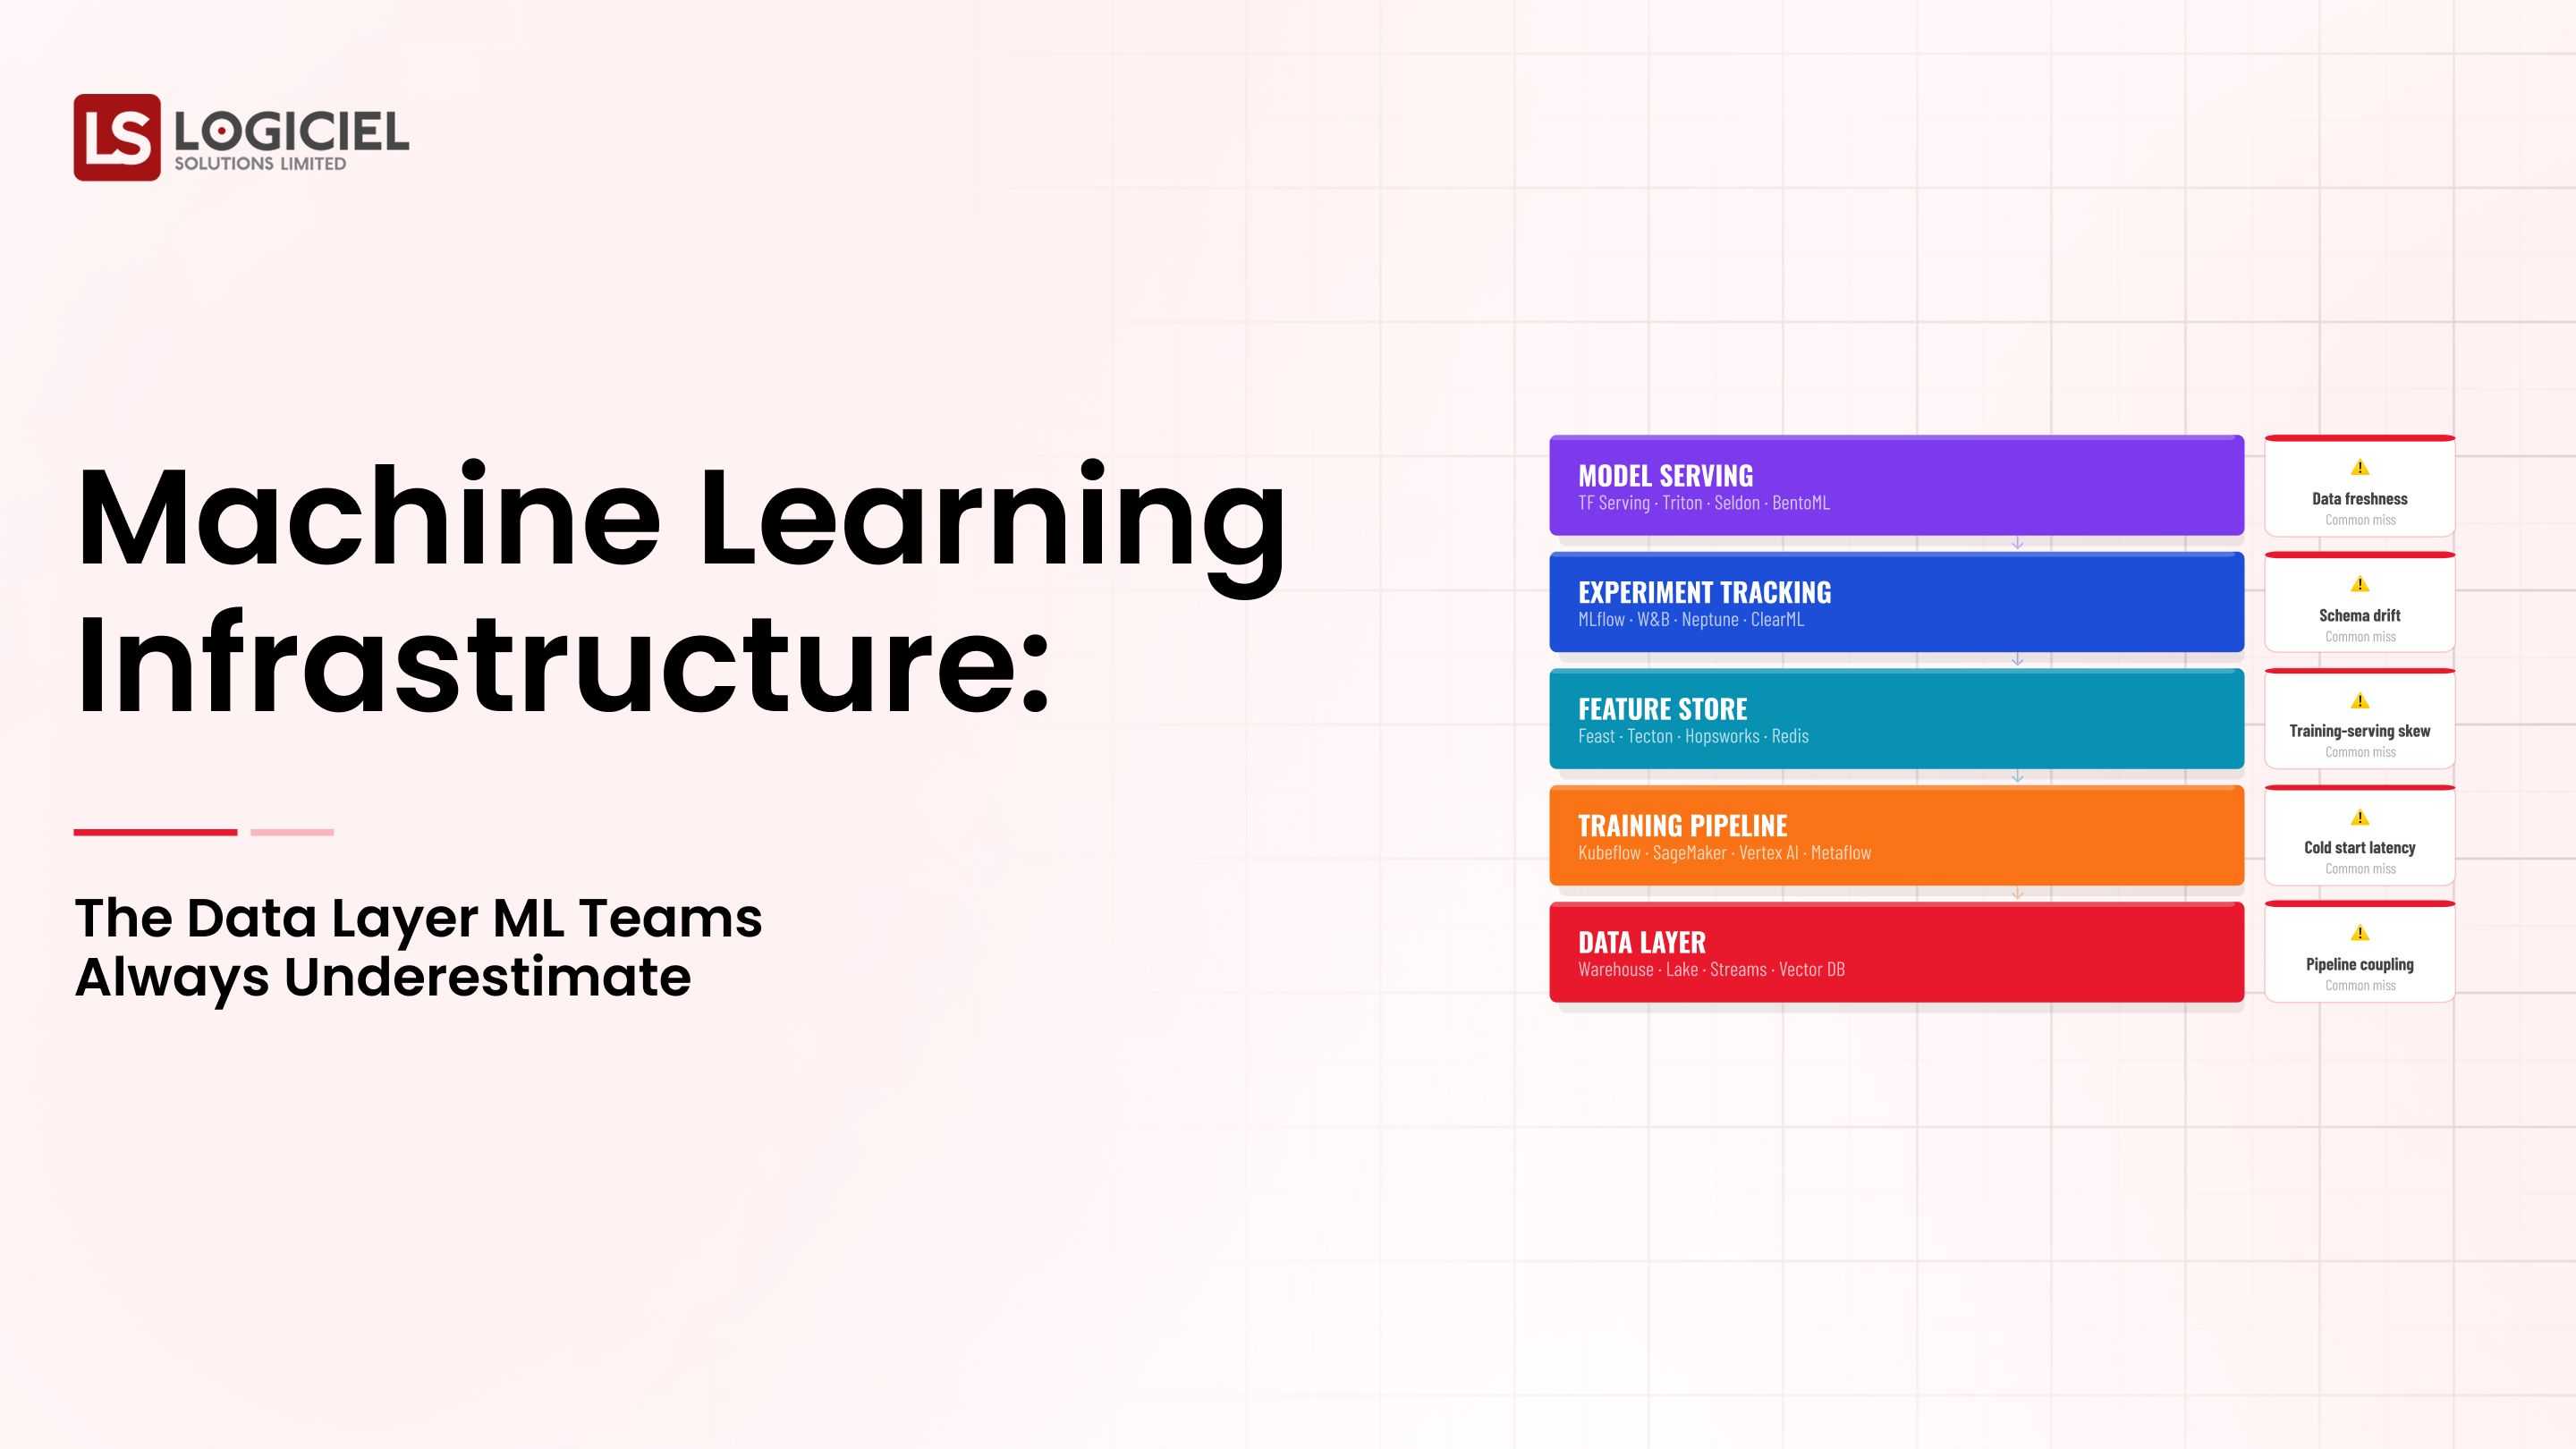
Metrics that will Generate Real Performance and Measure Business Impact are:
1. Overall Pipeline Availability Index or % of Pipelines that meet their Service Level Agreements (SLA)
a. Overall Pipelines Availability Index or % of Pipelines meeting SLA's measures the level of ongoing stability of a system both currently and over time, as well as the ability of the system to produce level of trust in all users of the data produced.
b. Overall Pipelines' Availability Target should be at least 99% for critical pipelines.
2. Mean Time to Detection and Mean Time to Repair (MTD & MTR)
Note:
mean time to detection - the amount of time taken by an organization to discover a problem after the problem has started; mean time to repair - the amount of time taken by an organization to fix a problem after a problem has been discovered.
a. The quicker that a firm is able to detect problems with the integrity or availability of data, the greater the level of business impact will be mitigated through this detection.
b. The faster an organization is able to repair an integrity issue determined through the means of this metric(s), the more reliable the system will be at producing data.
In a study, high performance teams reduced their mean time to repair by over 50% through the utilization of a robust observability metric.
3. Data Freshness
a. Data Freshness represents the time lag that exists from the moment an event occurs in any transactional system to when that event is able to be consumed/completed by an end user through their front-end system.
b. Data freshness is critical in providing the accuracy of information necessary for decision-making in "real-time".
c. Fraud detection requires near-zero data lag.
4. Business Impact Metrics
a. Organizations should track:
i. The amount of time that decisions were delayed as the result of having inaccurate or invalid data
ii. The associated revenue loss that occurred as a result of those erroneous data.
b. These metrics will be critical in establishing a connection between your infrastructure's performance and your organization's overall performance/productivity.
5. Cost per Processed Event/Query
a. Cost per event/query represents the total amount expended divided by the total amount of workload produced.
Why is it Important:
- Optimize infrastructure costs.
- Provide support for chief financial officer decisions.
Avoiding vanity metrics:
- Volume of total data processed.
- Number of pipelines created.
- Total number of queries, without context.
Although they tend to look impressive on a surface basis, they do not provide useful actionable information.
Leading Indicators - Weekly Tracking:
A leading indicator lets you proactively identify problems before they increase significantly.
1. Pipeline Meeting Service Level Agreement (SLA)|
Help track the long-term trend of:
- Are pipelines consistently meeting SLAs?
- Is pipeline performance improving or degrading?
2. Error Rates by Pipeline Stage
(brake out errors per stage); Ingest Transformation, Load Allow you to quickly identify points of failure.
3. Data Freshness by Domain
Different domains have different needs (example):
- Real-time analytics = very low latency
- Reports = Higher tolerance than real-time
Ensures that the data's freshness complies with their applicable requirements.
4. Number of Incidents Outstanding & Average Time for Resolution
Track both number of active incidents along with average time it takes to resolve them.
If you see a rising trend, you might have some systemic issue that you're not aware of.
5. Engineering Time Allocation
Monitor:
- % of time spent on maintenance
- % of time devoted to new development
A healthy engineer should strive for:
- <30% Maintenance
- 70% Innovation
The main point to remember is that leading indicators provide you insight into when to make changes by serving as an early warning system for your data management infrastructure.
Lagging Indicators-Monthly & Quarterly Reporting:
Lagging indicators are used to measure your long-term performance of your infrastructure.
1. Reduction of Data-Related Escalations
Count the total number of times you receive complaints from business teams and calculate the frequency of those escalation issues.
If you are seeing a reduction in the number of complaints and escalations you are receiving with respect to how your systems are functioning, then your reliability level will improve.
2. Compliance Metrics
- Audit Pass Rate
- Total number of (days/hours) to provide an adequate amount of evidence to prove compliance.
Compliance metrics are especially important in regulated industries.
3. Data Adoption Rate
Data Adoption:
Total Percentage of All Data Products Used
Data Adoption Rate Is Defined as the percentage of all data products actively being utilized.
Importance of Data Adoption Rate:
- Indicates the level of trust that users have placed in your data
- Reflects the usefulness of your data management system
Measuring the Cost of Infrastructure for Each Business Unit
Tracking costs by the following measurement systems:
- Data Usage
- Business Value
This provides justification for infrastructure investments.
5. Trending
Tracking for your metrics over time:
- Assessing areas of reason for improvement
- Identifying areas of regression
Key Insight
Lagging indicators allow you to measure if your strategy for Data Infrastructure Management is providing you results.
How to Present Your Results to Leadership
Metrics will only matter if leadership understands them.
1. Translate Metrics to Business Outcomes
For example:
How to best explain:
"You improved the pipeline success rate by 2%."
Instead, use this example:
"We improved the reliability of data, which decreased our reporting delays by 30%."
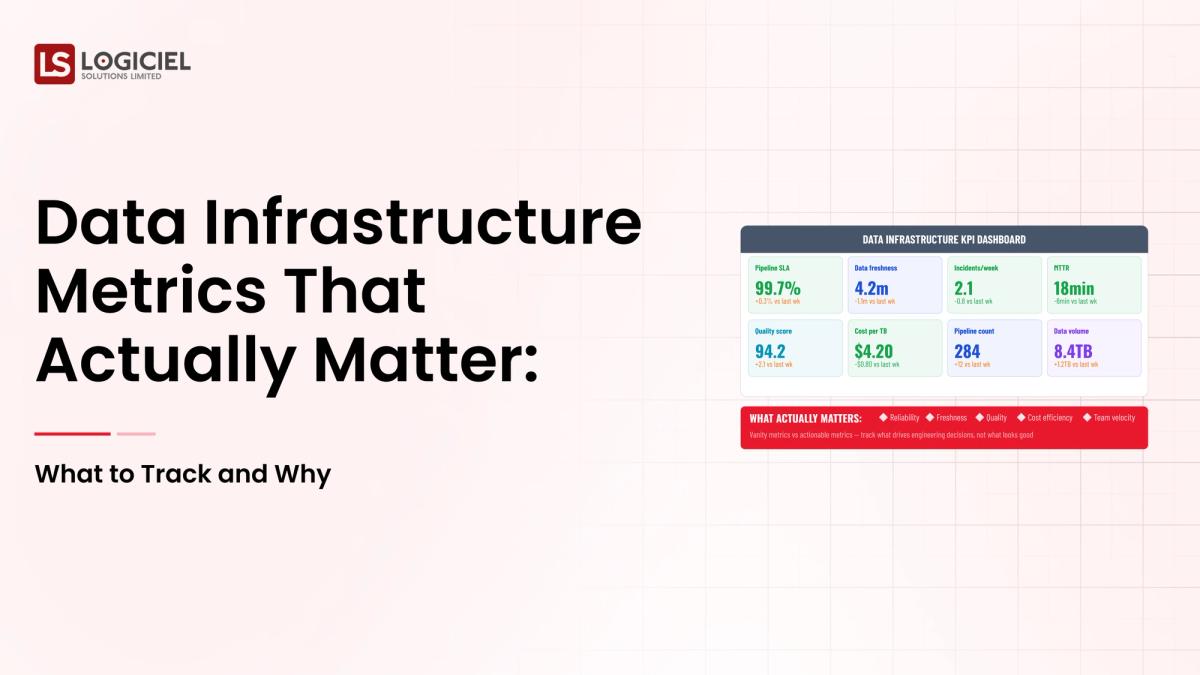
2. Provide One-Page Dashboard
With the following Metrics to include:
- Reliability Metrics
- Cost Metrics
- Business Impact
Keep all information concise and actionable.
3. Present a Clear Story
Assemble the content of the story in the following structure:
- Where We Were
- Where We Changed
- Where We Improved
This creates confidence for making future investments.
4. Justify Future Investment
Use the current metrics as the basis for demonstrating:
- Gaps that need to be filled
- Return on Investment Opportunities
For Example,
"When you reduce your Mean Time To Recovery by 20% you will save XXXX hours every month."
Key Insight
Good communication can convert engineering metrics into strategic decisions.
Building a Culture of Measurement that will succeed
Metrics alone will not create change. Cultural values will create change.
1. Make Metrics Available to the Team
Good Leadership should have dashboards in place and provide the team with real-time screens to view the performance of the metrics.
Visibility will create accountability.
2. Create Work Flows that have Metrics Built-in
As part of the Sprints, utilize the metrics during planning and also during retrospective meetings.
This will help to maintain continual focus upon the metrics.
3. Provide Access to Stakeholders
Allow the business teams and the teams to view reliability metrics and understand the service-level agreements will help develop trust with both the Business and IT teams.
4. Automate Your Measurement Process
A manual measurement process will not accomplish scalability.
Logiciel:
- Track reliability automatically
- Identify anomalies
- Unified dashboards
Key Insight
When measurement culture is strong, your data platform can become an ever-improving system.
Conclusion
Measuring your data infrastructure management focuses on tracking the important things, not everything.
Three Key Takeaways
- Focus on outcomes rather than outputs
- Don't just measure activity, measure impact on the business
- Use leading and lagging indicators together
- Predict issues and validate improvements
- Communicate clearly with leadership
- Decision-making should be guided by metrics and not confusion
If done well, measurement will provide you with:
- Increased data reliability
- Improved speed of decision making
- More efficient resource allocation
Budget Approval Playbook
Inside a 5-step framework that won $500K of infrastructure budget in 14 days.
Call to action:
If you're looking to strengthen your measurement framework:
Start with:
- Why is Your Data Infrastructure Always Broken - Root Causes and Real Solutions
- How to Develop a Data Infrastructure Roadmap - Framework for Engineering Leaders
Or:
👉 Sign up for a free infrastructure metric audit or download our KPI checklist.
We assist data leaders in developing AI-first, measurable infrastructure systems here at Logiciel Solutions.
- Data observability
- Reliability engineering
- Intelligent automation

These elements will support your transformation from reactive metrics to predictive performance management.
Frequently Asked Questions
What are the top metrics to measure a successful data infrastructure?
Pipeline reliability, MTTR, data freshness, and business impact indicators are among the most important metrics and accurately reflect the overall health and value of the data infrastructure.
How do vanity metrics harm the data infrastructure?
Metrics such as total data processed are vanity because they do not provide value or reflect the performance of the data infrastructure. Vanity metrics often misdirect priorities.
How frequently should a review of infrastructure metrics occur?
Leading indicators are best examined on a weekly basis whereas a review of lagging indicators can take place monthly to quarterly.
What is the process for connecting infrastructure metrics to the value of a business?
Translating the technical improvements achieved through successful infrastructure metrics into measurable outcomes such as reduced cost and downtime will support the connection.
What tools support the tracking of metrics for a data infrastructure?
Technical metrics can now typically be tracked and analyzed automatically through modern platforms that integrate observability, lineage, and monitoring into a unified system.