There is a service in production behaving strangely, and the team debugging it is realizing, in the middle of the incident, that the one signal they need was never emitted. The logs are there but say nothing useful. There is no metric for the thing that is failing and no trace to follow the request through. The instrumentation that would answer the question does not exist yet, and adding it now means a deploy in the middle of a fire.
This is more than missing telemetry. It is the absence of observability-driven development.
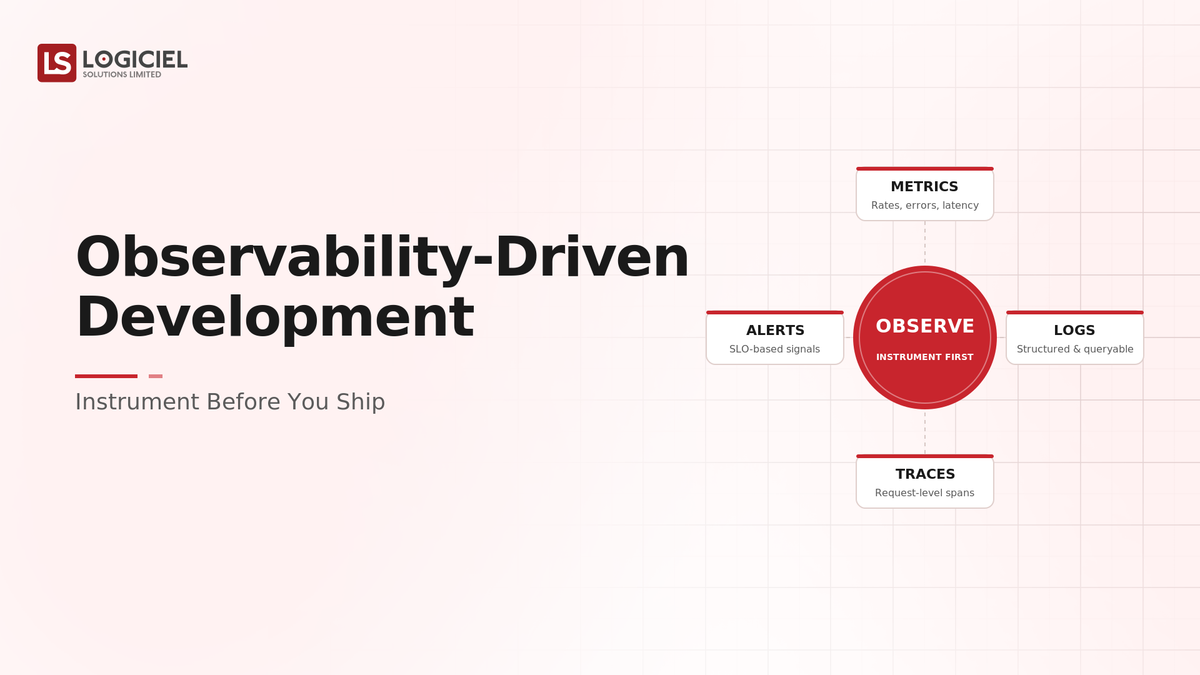
Observability-driven development is more than adding monitoring after launch. It is the practice of instrumenting a system as part of building it, asking "how will I debug this in production" while writing the code, so the signals needed to understand a failure exist before the failure does.
However, many teams treat observability as an operations concern added after an incident, and discover that the time to instrument a system is before you need the instruments, not during the outage.
If you are an engineering or platform leader responsible for debuggable systems, the intent of this article is:
- Define observability-driven development and how it differs from after-the-fact monitoring
- Walk through instrumenting as part of building
- Lay out the signals and practices a debuggable system needs
To do that, let's start with the basics.
Where Health Data Standards Break in Real Systems
Why FHIR R4 certification does not equal FHIR interoperability, the specific data availability.
What Is Observability-Driven Development? The Basic Definition
At a high level, observability-driven development is the practice of building instrumentation, logs, metrics, and traces, into a system as it is written, treating "can I understand this in production" as a development requirement rather than an operations afterthought.
To compare:
If after-the-fact monitoring is installing smoke detectors after the first fire, observability-driven development is wiring them in while building the house. You design for the question "how would I know" before there is an emergency asking it.
Why Is Observability-Driven Development Necessary?
Issues that observability-driven development addresses or resolves:
- Ensuring the signals needed to debug a failure exist before it happens
- Reducing time to diagnose production problems
- Catching unknown-unknowns that predefined dashboards miss
Resolved Issues by Observability-Driven Development
- Removes the mid-incident scramble to add missing instrumentation
- Shortens mean time to diagnosis with signals already in place
- Enables asking new questions of a system, not just predefined ones
Core Components of Observability-Driven Development
- Instrumentation written alongside the code
- Structured logs, metrics, and traces, the three pillars
- High-cardinality context to answer unanticipated questions
- Debuggability treated as a development requirement
- Cost-awareness so observability does not become its own bill
Modern Observability Tools
- OpenTelemetry as the vendor-neutral instrumentation standard
- Datadog, Grafana, Honeycomb, and similar for storage and querying
- Distributed tracing for following requests across services
- Structured logging libraries emitting queryable context
- Cost-control features to manage telemetry volume
These tools support the practice, but the practice is instrumenting as you build, not buying a platform and hoping it sees everything.
Other Core Issues They Will Solve
- Provide the context to investigate novel failures, not just known ones
- Give teams confidence to ship complex changes they can observe
- Reduce reliance on reproducing bugs locally to understand them
Importance of Observability-Driven Development in 2026
Building observability in matters more as systems grow more distributed and complex. Four reasons explain why it matters now.
1. Distributed systems fail in novel ways.
Microservices and async flows fail in combinations no one predicted. Predefined dashboards cannot anticipate them; rich instrumentation lets you investigate them.
2. The signal you need is the one you did not add.
Incidents routinely hinge on a signal that was never emitted. Instrumenting during development is the only way to have it ready.
3. Mean time to diagnosis dominates downtime.
Most of an incident is spent figuring out what is wrong, not fixing it. Good observability collapses that time.
4. Observability cost is now significant.
Telemetry volume can rival compute cost. Building observability thoughtfully, not just verbosely, keeps it useful and affordable.
Traditional vs. Modern Observability
- Add monitoring after launch vs. instrument while building
- Logs only vs. logs, metrics, and traces together
- Predefined dashboards vs. ability to ask new questions
- Operations concern vs. development requirement
In summary: Modern observability is built into the system during development, not bolted on after the first incident.
Details About the Core Components of Observability-Driven Development: What Are You Building?
Let's go through each element.
1. Instrumentation Layer
The signals emitted from the code.
Instrumentation decisions:
- Written alongside the feature, not later
- Covering the paths and states that matter
- Using a standard like OpenTelemetry
2. Three Pillars Layer
Logs, metrics, and traces.
Pillar decisions:
- Structured logs for queryable detail
- Metrics for aggregate health and alerting
- Traces for following requests across services
3. Context Layer
The richness that answers new questions.
Context decisions:
- High-cardinality attributes on events
- Identifiers that tie signals to requests and users
- Enough context to investigate the unanticipated
4. Requirement Layer
Treating debuggability as part of done.
Requirement decisions:
- "How will I debug this" asked during design
- Instrumentation part of the definition of done
- Reviewed like any other code
5. Cost Layer
Keeping observability affordable.
Cost decisions:
- Sampling and retention tuned to need
- Telemetry volume monitored
- Signal kept high, noise low
Benefits Gained from Instrumenting Before Shipping
- The signals needed to debug a failure are already present
- Diagnosis is faster because the questions can be asked
- Novel failures are investigable, not just the anticipated ones
How It All Works Together
As a feature is built, the engineer asks how they would understand it failing in production and instruments accordingly: structured logs with rich context, metrics for health and alerting, and traces that follow the request across services. High-cardinality attributes mean new questions can be asked of the data, not just the ones a dashboard anticipated. Debuggability is part of the definition of done and reviewed like any other code. Sampling and retention keep the telemetry affordable. When something goes wrong, the signals are already there, and the team investigates rather than scrambles to add instrumentation mid-incident.
Common Misconception
Observability is monitoring you set up after the system is running.
Observability is the property of being able to understand a system from its outputs, and that property has to be built in as the system is written. Monitoring added after the fact answers only the questions someone thought to ask; instrumentation built in lets you ask new ones.
Key Takeaway: You cannot instrument your way out of an incident in the middle of it. The signals have to exist before the failure, which means building them in.
Real-World Observability-Driven Development in Action
Let's take a look at how the practice operates with a real-world example.
We worked with a team whose incidents kept stalling on missing instrumentation, with these constraints:
- Ensure the signals to debug failures exist before they happen
- Shorten time to diagnosis in production
- Keep telemetry cost from spiraling
Step 1: Make Debuggability Part of Done
Ask the debugging question during development.
- "How will I debug this in production" asked at design
- Instrumentation added to the definition of done
- Telemetry reviewed like code
Step 2: Instrument the Three Pillars
Emit logs, metrics, and traces as the feature is built.
- Structured logs with context
- Metrics for health and alerting
- Traces across service boundaries
Step 3: Add High-Cardinality Context
Enable questions no one predefined.
- Rich attributes on events
- Request and user identifiers
- Context for investigating the unanticipated
Step 4: Manage Cost
Keep observability affordable and useful.
- Sampling and retention tuned
- Telemetry volume monitored
- Noise reduced, signal preserved
Step 5: Validate Debuggability
Confirm the system can actually be understood.
- Game-day or failure injection to test signals
- Gaps in instrumentation closed
- The debugging experience rehearsed
Where It Works Well
- Instrumentation written alongside the code, with all three pillars
- High-cardinality context enabling new questions
- Debuggability validated before, not during, an incident
Where It Does Not Work Well
- Adding monitoring only after the first production incident
- Logs alone, with no metrics or traces
- Verbose telemetry with no cost control, becoming its own bill
Key Takeaway: The system you can debug in production is the one instrumented while it was built, with the signals and context already present, not the one you scramble to instrument mid-incident.
Common Pitfalls
i) Instrumenting after the incident
The signal you need is the one you did not add, and you cannot add it during the outage. Build instrumentation in as you write the code.
- Ask the debugging question at design
- Make instrumentation part of done
- Validate before you need it
ii) Logs without metrics or traces
Logs alone cannot show aggregate health or follow a request across services. Use all three pillars.
iii) No high-cardinality context
Without rich context, you can only answer predefined questions. Real incidents are unanticipated; instrument for new questions.
iv) Ignoring observability cost
Verbose telemetry can rival compute cost. Tune sampling and retention so observability stays affordable and signal stays high.
Takeaway from these lessons: Most slow incidents trace to missing signals, not to hard problems. Instrument as you build, cover all three pillars, and keep context rich and cost controlled.
Observability-Driven Development Best Practices: What High-Performing Teams Do Differently
1. Ask "how will I debug this" while building
Make the debugging question a design-time concern, so the signals exist before the failure that needs them.
2. Instrument all three pillars
Logs, metrics, and traces each answer different questions. A debuggable system needs all three, not just verbose logs.
3. Capture high-cardinality context
Rich attributes let you investigate the unanticipated, which is what real incidents are. Predefined dashboards are not enough.
4. Treat instrumentation as part of done
Review telemetry like code and include it in the definition of done. Observability added later is observability you will lack during an incident.
5. Control telemetry cost
Tune sampling and retention so observability stays affordable. Verbose-by-default telemetry becomes a bill that pressures teams to cut the signals they need.
Logiciel's value add is helping teams make debuggability a development requirement, instrument the three pillars with rich context, and control telemetry cost, so production systems are understandable before the incident, not during it.
Takeaway for High-Performing Teams: Focus on building observability in. The signals that resolve an incident quickly are the ones that already existed, which means instrumenting as you write the code, not after the first fire.
Signals You Are Practicing Observability-Driven Development Correctly
How do you know the practice is set up to succeed? Not in the size of the observability bill, but in how incidents go. Below are the signals that distinguish built-in observability from bolted-on monitoring.
Incidents rarely stall on missing signals. The team can investigate failures with instrumentation that already exists, not by adding it mid-incident.
All three pillars are present. The team uses logs, metrics, and traces together, not logs alone.
New questions can be asked. The team can query the telemetry for things no dashboard anticipated, thanks to high-cardinality context.
Instrumentation ships with features. Telemetry is part of the definition of done and reviewed like code.
Observability cost is controlled. The team can show sampling and retention tuned so the bill stays proportional to the value.
Adjacent Capabilities and Connected Work
This work does not exist in isolation. Observability-driven development depends on, and feeds into, several adjacent capabilities. Building one without thinking about the others is the most common scoping mistake.
In most enterprise programs, observability shares infrastructure with the telemetry platform, the CI/CD pipeline, and the incident management process. It shares team capacity with platform engineering, SRE, and the application teams that instrument their services. And it shares leadership attention with whatever the next reliability initiative is on the roadmap. Naming these adjacencies upfront helps the program scope realistically and helps leadership see the work as a portfolio rather than a one-off project.
The most common mistake in adjacent-capability scoping is treating each adjacency as someone else's problem. The telemetry platform that stores and queries signals is your problem to integrate. The incident process that consumes the signals is your problem. The cost of the telemetry you emit is your problem. Pretending otherwise pushes work to teams that did not plan for it, and the work returns to you later as a blind spot during an incident or a runaway observability bill. Own the adjacencies you depend on; partner with the teams that own them; share the timeline.
Conclusion
Observability-driven development makes a system understandable in production by building the signals in as it is written. The discipline that turns a mid-incident scramble into a fast investigation is the same discipline behind any quality practice: design for the hard case before it arrives.
Key Takeaways:
- Observability must be built in during development, not added after an incident
- Instrument all three pillars with high-cardinality context
- Treat debuggability as part of done and control telemetry cost
Practicing observability-driven development well requires instrumentation, context, and cost discipline. When done correctly, it produces:
- The signals to debug a failure already present when it happens
- Faster diagnosis and shorter incidents
- The ability to investigate novel failures, not just anticipated ones
- Observability that stays affordable and high-signal
What Logiciel Does Here
If your incidents keep stalling on missing telemetry, make debuggability part of the definition of done, instrument all three pillars with rich context, and validate it before the next failure.
What Logiciel Does Here
If your incidents keep stalling on missing telemetry, make debuggability part of the definition of done, instrument all three pillars with rich context, and validate it before the next failure.
Learn More Here:
- The On-Call Data Engineer: Runbooks for 3 AM Pipeline Failures
- The Observability Bill: When Monitoring Costs More Than Compute
- Observability Across Cloud: Logs, Metrics, Traces — and Now Cost
At Logiciel Solutions, we work with engineering and platform leaders on observability strategy, instrumentation, and telemetry cost control. Our reference patterns come from production distributed systems.
Explore how to instrument your systems before you ship them.
Frequently Asked Questions
What is observability-driven development?
It is the practice of building instrumentation, logs, metrics, and traces, into a system as it is written, treating "can I understand this in production" as a development requirement. The goal is that the signals needed to debug a failure exist before the failure does.
How is it different from monitoring?
Monitoring added after the fact answers only the questions someone anticipated and set up dashboards for. Observability built in during development, with rich context, lets you ask new questions of a running system, which is what real, unanticipated incidents require.
What are the three pillars of observability?
Structured logs for queryable detail, metrics for aggregate health and alerting, and distributed traces for following a request across services. A debuggable system needs all three, since each answers different questions.
Why does high-cardinality context matter?
Because real incidents are unanticipated, and predefined dashboards can only answer predefined questions. High-cardinality attributes, like request and user identifiers, let you slice the data to investigate failures no one predicted.
What is the biggest mistake in observability?
Treating it as an operations task added after the first incident. The signal you need is invariably the one you did not add, and you cannot add it during the outage. Instrument as you build, and validate debuggability before you need it.