There is a Head of Data being asked to scale data quality across thousands of datasets. The current process is manual checks, weekly review, and an occasional fire drill. It does not scale.
This is more than a delivery question. It is a failure of data quality at scale discipline when handled poorly, and a multiplier when handled well.
A modern approach to data quality at scale is more than tooling. It is the discipline of seeing what your systems are actually doing in production, not what you assumed they were doing, supported by the operating model that keeps it current.
Evaluation Differnitator Framework
Why great CTOs don’t just build they evaluate. Use this framework to spot bottlenecks and benchmark performance.
However, many teams treat data quality at scale as a one-off project and discover the discipline gap when production exposes the gaps the lab hid. The data org used to be a service desk. Now it's a profit lever. Most companies haven't caught up.
If you are a Head of Data and are responsible for building or scaling your data quality program, the intent of this article is:
- Define what data quality at scale actually means in production
- Walk through the patterns that work and the ones that look smart and quietly fail
- Lay out the operating model that turns data quality at scale from a project into infrastructure
To do that, let's start with the basics.
What Is Data Quality at Scale? The Basic Definition
At a high level, data quality at scale is the discipline of seeing what your systems are actually doing in production, not what you assumed they were doing.
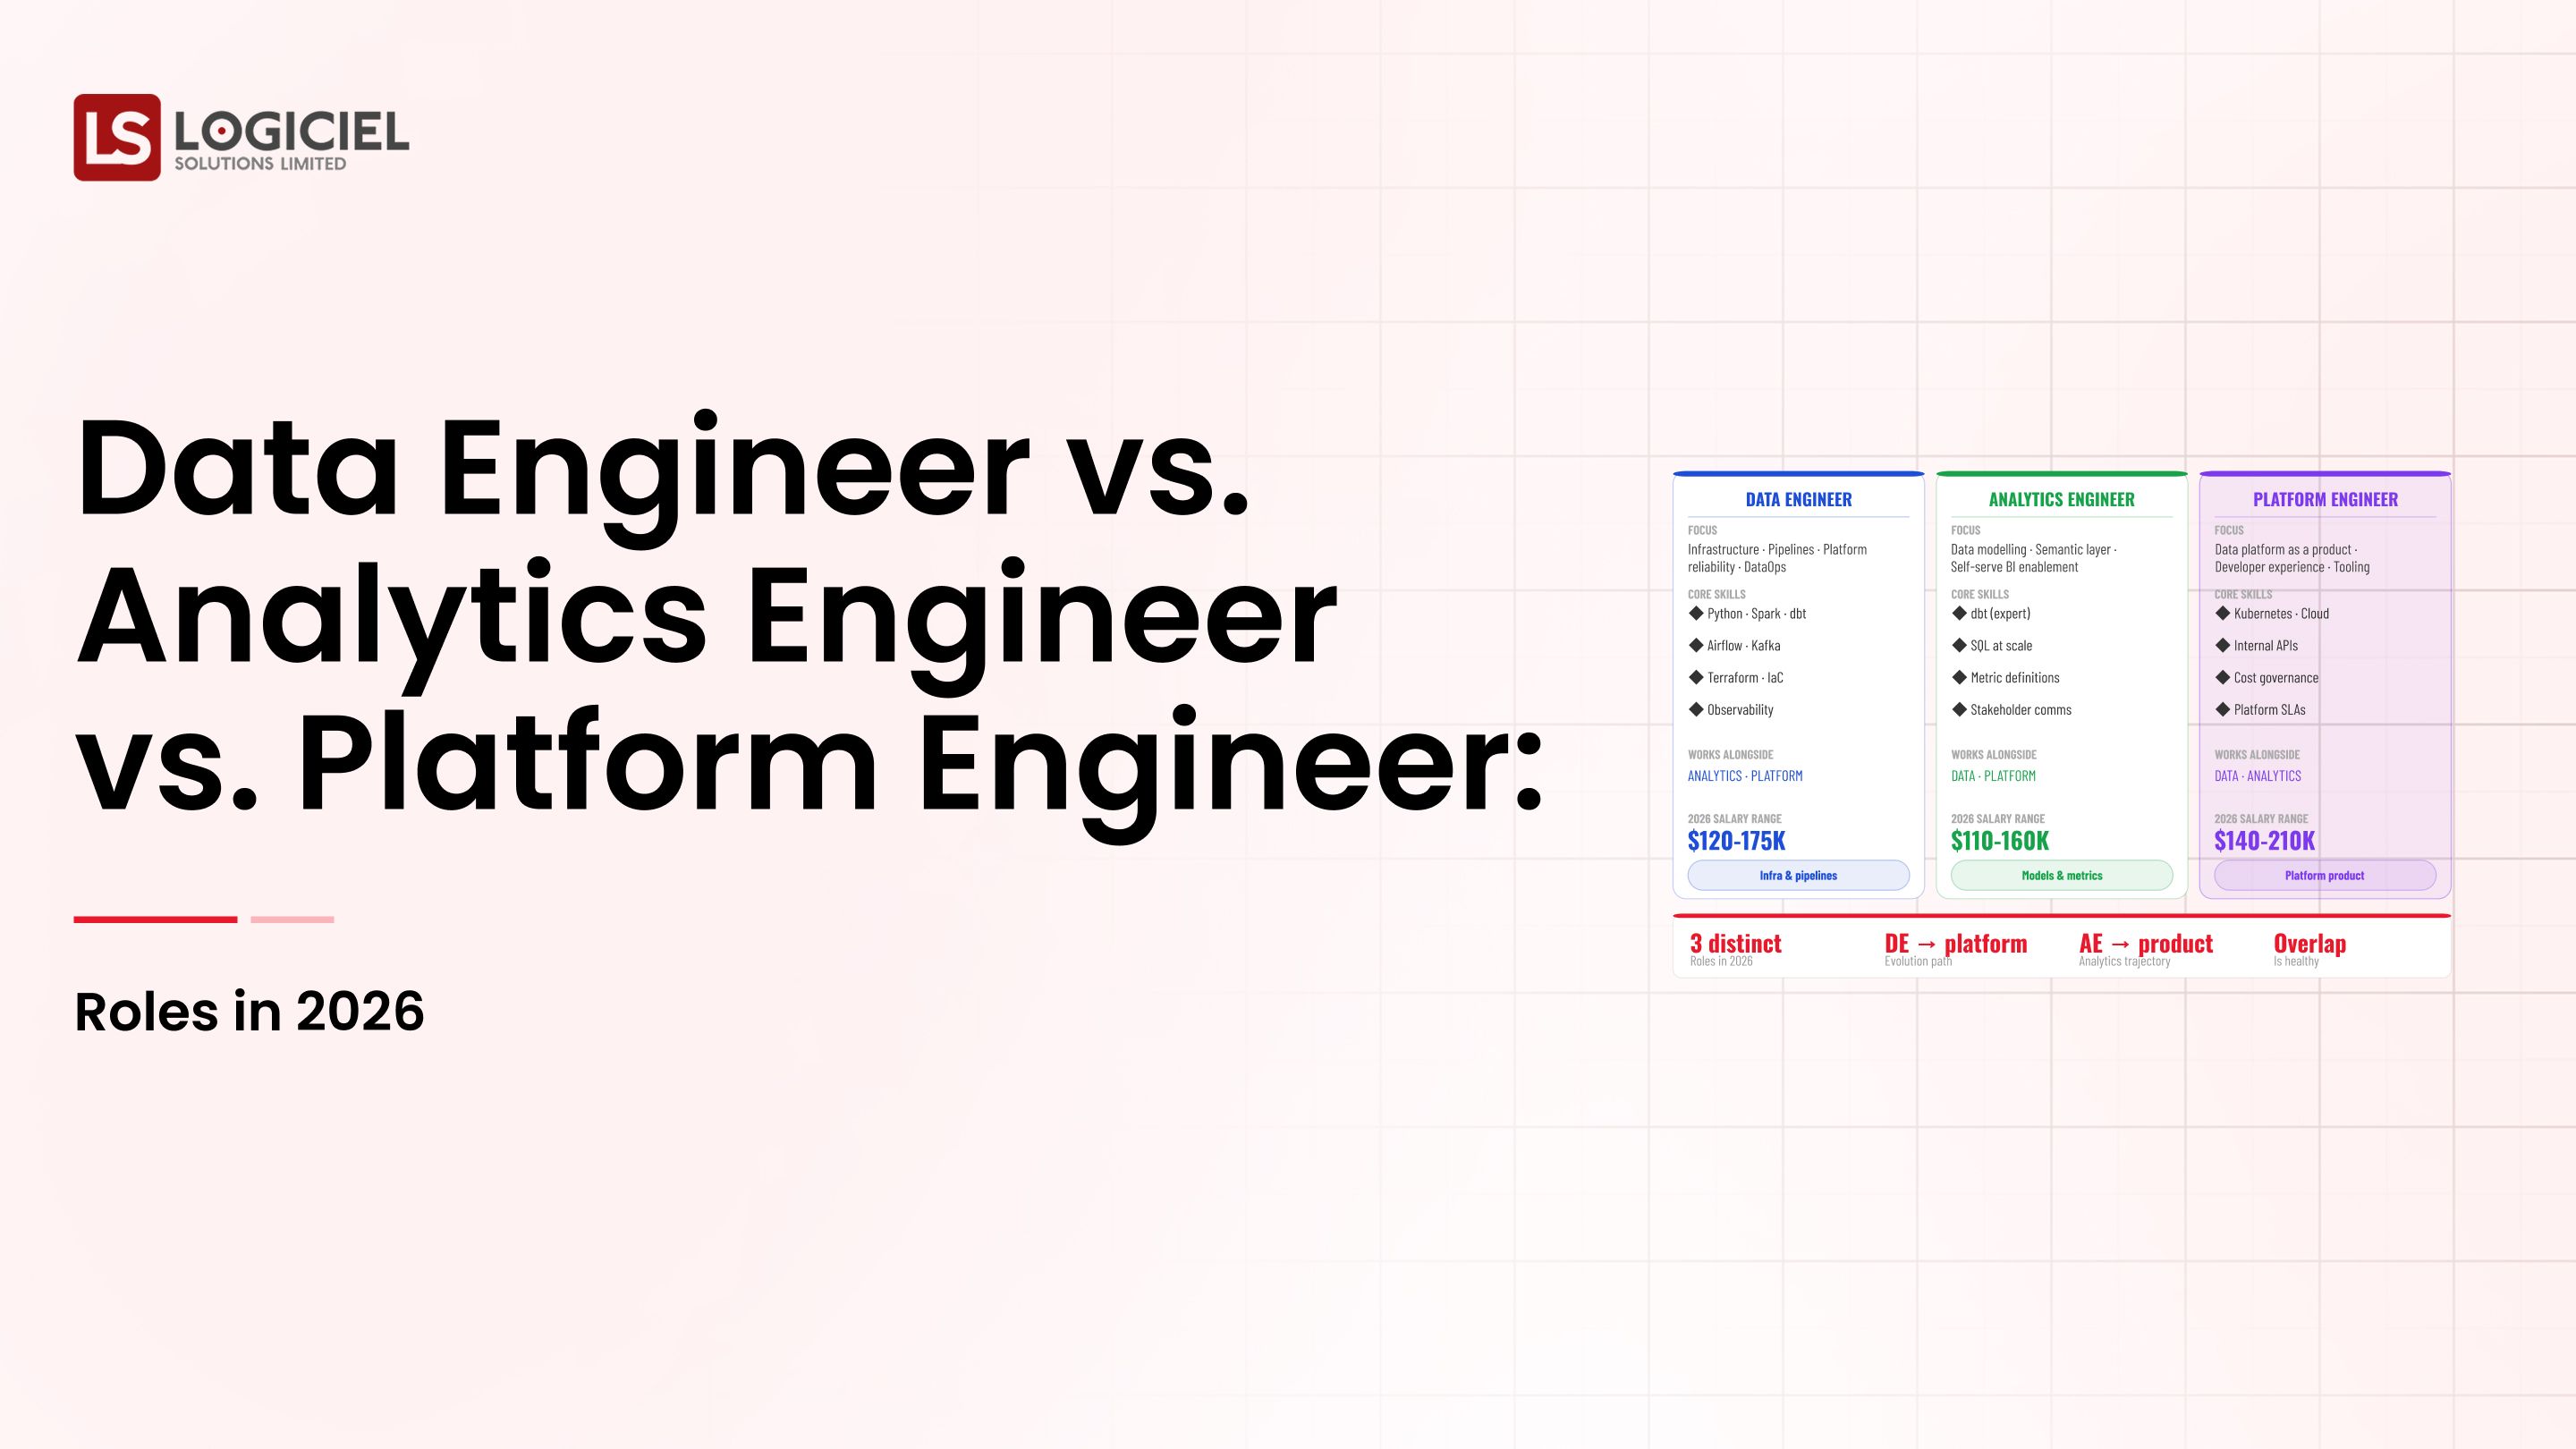
To compare:
If most teams treat data quality at scale as a tooling decision, mature teams treat it as a system design problem with the tooling as one input among several.
Why Is Data Quality at Scale Necessary?
Issues that Data Quality at Scale addresses or resolves:
- Bringing data quality at scale work under engineering discipline rather than improvisation
- Surfacing failure modes before customers or auditors do
- Building the platform that compounds across future programs
Resolved Issues by Data Quality at Scale
- Provides explicit contracts and ownership
- Captures evidence of behavior for audit and review
- Establishes the cadence that prevents drift
Core Components of Data Quality at Scale
- Foundational layer that data quality at scale depends on
- Operating layer that sustains the program
- Observability across the system
- Governance and policy enforcement
- Cadence and review process
Modern Data Quality at Scale Tools
- Industry-standard platforms in this category
- Open-source alternatives where appropriate
- Observability tooling tuned for this workload
- Internal abstractions over vendor APIs
- Audit and compliance tooling
Tools support the discipline; the operating practice is the differentiator.
Other Core Issues They Will Solve
- Reduces incident severity through earlier detection
- Provides defensible evidence for board and audit conversations
- Builds reusable patterns across the program portfolio
In Summary: Data Quality at Scale is the operating discipline that turns a tooling question into a system question.
Importance of Data Quality at Scale in 2026
Data Quality at Scale matters more in 2026 than it did even two years ago. Four reasons explain why.
1. Stakes have risen.
What used to be a back-office question is now a board-level program for data quality at scale.
2. Operating models have not caught up.
Most enterprises still run this work as a project rather than infrastructure. The mismatch shows up in the second year.
3. Reuse compounds.
The platform built for the first program rides under every subsequent one. The first one is expensive; the fifth feels obvious.
4. Talent is scarce.
Hiring through the problem rarely works. Building the operating model first lets fewer people deliver more.
Traditional vs. Modern Data Quality at Scale Concepts
- Project-based data quality at scale vs. platform-based data quality at scale
- Implicit contracts vs. explicit contracts with testing
- Reactive incident response vs. observability-first operating model
- Annual review cadence vs. weekly or quarterly cadence
In summary: Data Quality at Scale is the foundation every modern program in this space rests on.
Details About the Core Components of Data Quality at Scale: What Are You Designing?
Let's go through each layer.
1. Data Quality at Scale Foundation Layer
What everything else rests on.
Foundation concerns:
- Architecture decisions that scale with usage
- Source-of-truth definitions
- Access patterns and contracts
2. Operating Layer
How the program is run day to day.
Operating components:
- On-call rotation and runbooks
- Cadence and review process
- Sunset criteria for capabilities not pulling weight
3. Observability Layer
Knowing what the program is doing.
Observability concerns:
- Quality and freshness signals
- Cost and unit economics
- Drift and anomaly detection
4. Governance Layer
How standards and policy are enforced.
Governance components:
- Policy enforced at runtime, not in documents
- Evidence captured automatically
- Quarterly review of policy and controls
5. Operating Cadence Layer
What keeps the program from eroding.
Cadence components:
- Weekly or monthly review on the dashboard
- Quarterly architecture review
- Incident-driven updates

Benefits Gained from Operating Discipline and Observability
- Predictable delivery without rework
- Faster recovery when things break
- Reusable platform layer for the next program
How It All Works Together
The foundation layer holds the system up. The operating layer runs it day to day. Observability surfaces what's happening. Governance keeps policy in force. Operating cadence keeps the layers current. Together, the layers turn data quality at scale from a question into a working program.
Common Misconception
Data Quality at Scale is just a tooling decision.
Data Quality at Scale is a system and operating decision. Tooling is one input among several. The discipline is the difference.
Key Takeaway: Each layer addresses a different class of risk. Programs that under-invest in any layer have predictable gaps.
Real-World Data Quality at Scale in Action
Let's take a look at how data quality at scale operates with a real-world example.
We worked with a team running data quality at scale for a multi-business-unit enterprise, with these constraints:
- Mixed workloads across multiple teams
- Strict audit and compliance requirements
- Cost shape sensitive to usage growth
Step 1: Inventory the Current State
Where the program is today, what works, what doesn't.
- Per-component assessment
- Gap analysis
- Documented current state
Step 2: Pick the Architecture
Match the architecture to the workload mix and operating model.
- Documented choice with tradeoffs
- Reusable pattern definitions
- Migration path documented
Step 3: Build the Foundation
Foundation layer first, operating layer second, observability and governance alongside.
- Foundation in place
- Operating model documented
- Observability instrumented
Step 4: Pilot, Iterate, Scale
Ship to a controlled population; absorb learning; scale.
- Pilot with named users
- Daily review of outcomes
- Scale after first-month learning
Step 5: Operate the Cadence
Weekly or monthly review on the dashboard; quarterly architecture review.
- Weekly cost and quality review
- Quarterly architecture review
- Named owner for the program
Where It Works Well
- Foundation layer designed for reuse across programs
- Operating model documented before launch
- Cadence sustained quarter after quarter
Where It Does Not Work Well
- Vendor-led decisions without architecture review
- Operating model invented during the first incident
- Annual review when systems change quarterly
Key Takeaway: The team that builds data quality at scale as infrastructure ships faster and recovers quicker than the team that builds it as a project.
Common Pitfalls
i) Treating Data Quality at Scale as a tooling decision
The tooling matters less than the operating model. Pick the tool after the design.
- Design before tooling
- Document tradeoffs
- Plan for change over time
ii) Skipping the operating model
Operating models invented during the first incident are operating models invented too late.
iii) No cadence
Without weekly or quarterly cadence, the program drifts. Schedule the review; protect the time.
iv) Hiring through the problem
Adding headcount to an unclear program slows it down. Diagnose first; hire second.
Takeaway from these lessons: Most failures are operating-model gaps, not technology gaps. The cadence is the work.
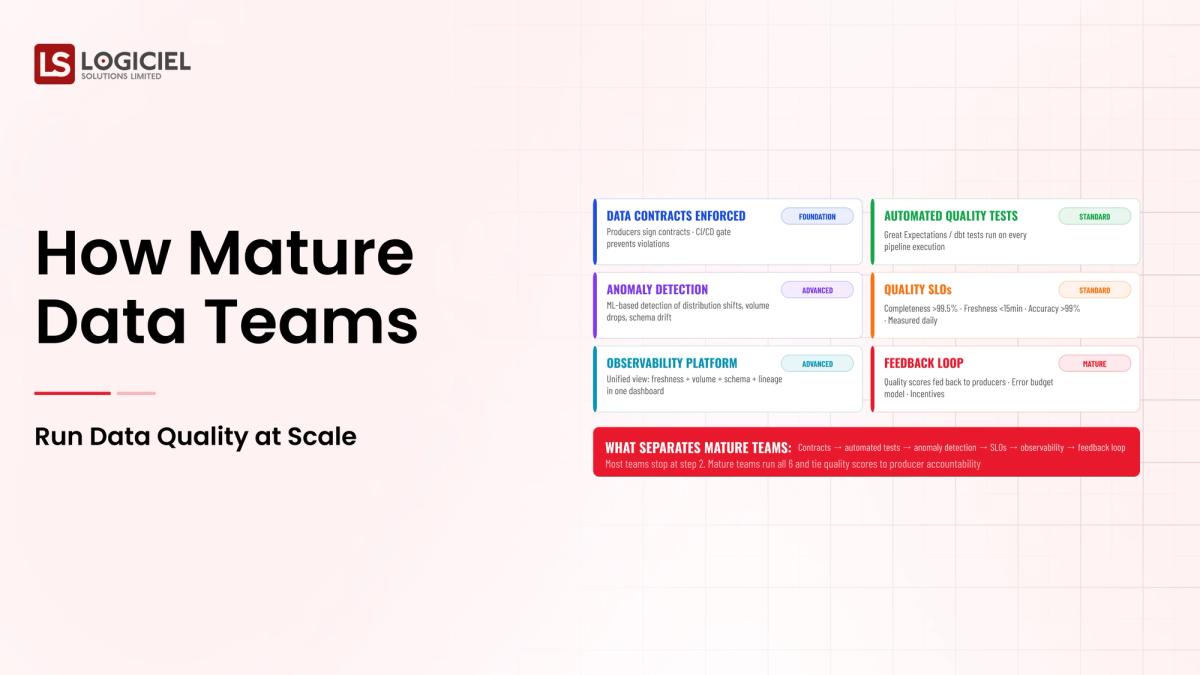
Data Quality at Scale Best Practices: What High-Performing Teams Do Differently
1. Design the foundation before the tools
Architecture and operating model first. Tools second.
2. Document the operating model
On-call rotation, runbooks, postmortems, sunset criteria. Built in, not bolted on.
3. Build observability streaming
Quality, cost, and freshness signals. Continuous, not periodic.
4. Run quarterly cadence
Architecture review, cost review, operating-model review. Without cadence, the program erodes.
5. Treat data quality at scale as a platform
Each new use case rides on the platform built for the first one. Reuse compounds.
Logiciel's value add is partnering with engineering and data leaders on data quality at scale programs, including the foundation, operating model, and cadence work that turns a one-off project into a multiplier.
Takeaway for High-Performing Teams: High-performing teams treat data quality at scale as infrastructure with quarterly cadence. The discipline is the difference.
Signals You Are Designing Data Quality at Scale Correctly
The board deck won't tell you whether the program is healthy. The team's daily evidence will.
Watch for whether the team can describe failure modes calmly. Programs that have been running long enough have failure modes; the team that talks about them without flinching is the team that's actually been running them.
Watch for cost visibility. Today, can the team tell you yesterday's spend and what changed? If yes, the discipline is real. If no, it's coming.
Watch for whether change feels boring. Routine deploys, routine rollbacks, routine model swaps. Drama in deploys is a sign of an immature system, not an exciting one.
Watch for whether eval runs every day. Live dashboard, real numbers, regression alerts. Not a quarterly slide with hand-waved confidence.
Watch for whether the team can quantify vendor lock-in. Rip-and-replace cost in dollars and weeks. Programs that can't answer this haven't done the math, which means the math is going to surprise them later.
Adjacent Capabilities and Connected Work
You can't run this in isolation. There are a handful of other surfaces it touches every week, and ignoring them is how programs lose their second quarter.
The data platform shows up first. Observability is right behind it. The security review process is rarely visible until you need it. Team capacity also splits across platform engineering, applied ML, and SRE; leadership attention splits across whatever the next AI initiative is. Pretending these neighbors don't exist is comfortable for about a month.
The dumbest version of this mistake is "that's their team's problem." It isn't. The data platform integration, the runtime security review, the on-call rotation that wakes up when something breaks: all yours, even if other teams technically own the surface. Treat the neighbors as collaborators with shared timelines, not as dependencies you can route around.
Stakeholder Considerations and Communication
You'll be asked the same questions in different shapes by different people. Worth thinking ahead about each.
Boards want risk, return, and competitive position. CFOs want the unit economics and a number that holds up across sensitivity scenarios. CISOs want the threat model and how you'll defend an audit. Engineering wants the scope, the build/buy split, and the operational load they'll carry. The line of business wants a date and a user experience.
Anticipate these and you save yourself from improvising in the hot seat. A one-page brief per audience, refreshed every quarter, is cheap. The only reason most programs don't have them is that nobody made it someone's job. Make it someone's job.
Cadence is the other half. Weekly updates while you're shipping. Monthly during steady-state. Every incident or material change, no exceptions. Programs that go quiet between releases lose the trust they earned earlier. Decide how often you'll talk to each stakeholder before you start, then keep that promise.
Metrics That Tell You Data Quality at Scale Is Working
The success signals above tell you what good looks like at a moment in time. These are the leading indicators that tell you whether the program is improving across moments.
The first is time from concept to deployment. If a new use case takes nine weeks to ship today and twelve weeks took to ship six months ago, the platform is paying back. If it took six weeks six months ago and nine weeks today, something is rotting.
The second is per-unit cost. Each quarter, are you spending less per unit of output, or more? If usage is flat, the answer is mostly about platform efficiency. If usage is growing, the answer is mostly about whether your cost shape held up under scale.
The third is incident severity. New programs have high-severity incidents because the operating model is new. Mature programs have lower-severity incidents because the operating model has absorbed the lessons. If your severity isn't dropping, your operating model isn't learning.
The fourth is reuse. Look at program two and program three. How much of what you built for program one is in them? High reuse means the platform investment is the gift that keeps giving. Low reuse means you're shipping the same thing over and over.
The fifth is sponsor confidence. Indirect, but readable in approved budget and strategic emphasis. If your sponsor is asking for more, you're winning. If they're asking you to slow down or scope down, the trust has shifted.
Conclusion
Data Quality at Scale is the discipline that separates programs that compound from programs that run in place. The layers are well known; the operating model is the work; the cadence is the multiplier.
Key Takeaways:
- Data Quality at Scale is system design plus operating discipline, not a tooling decision
- Foundation, operating, observability, governance, and cadence are co-equal layers
- Cadence prevents drift; reuse compounds across programs
When data quality at scale is built and operated correctly, the benefits compound:
- Predictable delivery and recovery
- Defensible audit and board posture
- Reusable platform that compounds across programs
- Stronger team morale and sponsor confidence over time
Agent-to-Agent Future Report
Understand how autonomous AI agents are reshaping engineering and DevOps workflows.
Call to Action
If your data quality at scale program is feeling fragile, the move this quarter is to inventory the layers you have, build the ones that are missing, and operate the cadence.
Learn More Here:
At Logiciel Solutions, we work with engineering and data leaders on data quality at scale programs that turn one-off projects into platform investments.
Explore how to modernize your data quality at scale program.
Frequently Asked Questions
What is data quality at scale?
The discipline of seeing what your systems are actually doing in production, not what you assumed they were doing, run as a discipline rather than a one-off project.
When does this matter most?
When the workload, scale, or audit requirements push past what improvisation can handle.
Who should own the program?
An engineering leader paired with the line of business. Joint ownership prevents the program from stalling at the first hard tradeoff.
How long does it take to build out?
Eight to sixteen weeks for a first useful version with disciplined scope. Programs that take longer almost always missed it at the framing stage.
What is the biggest mistake in data quality at scale?
Treating it as a one-off project rather than a platform investment. The first program builds the platform; the platform compounds.